
Quick Summary
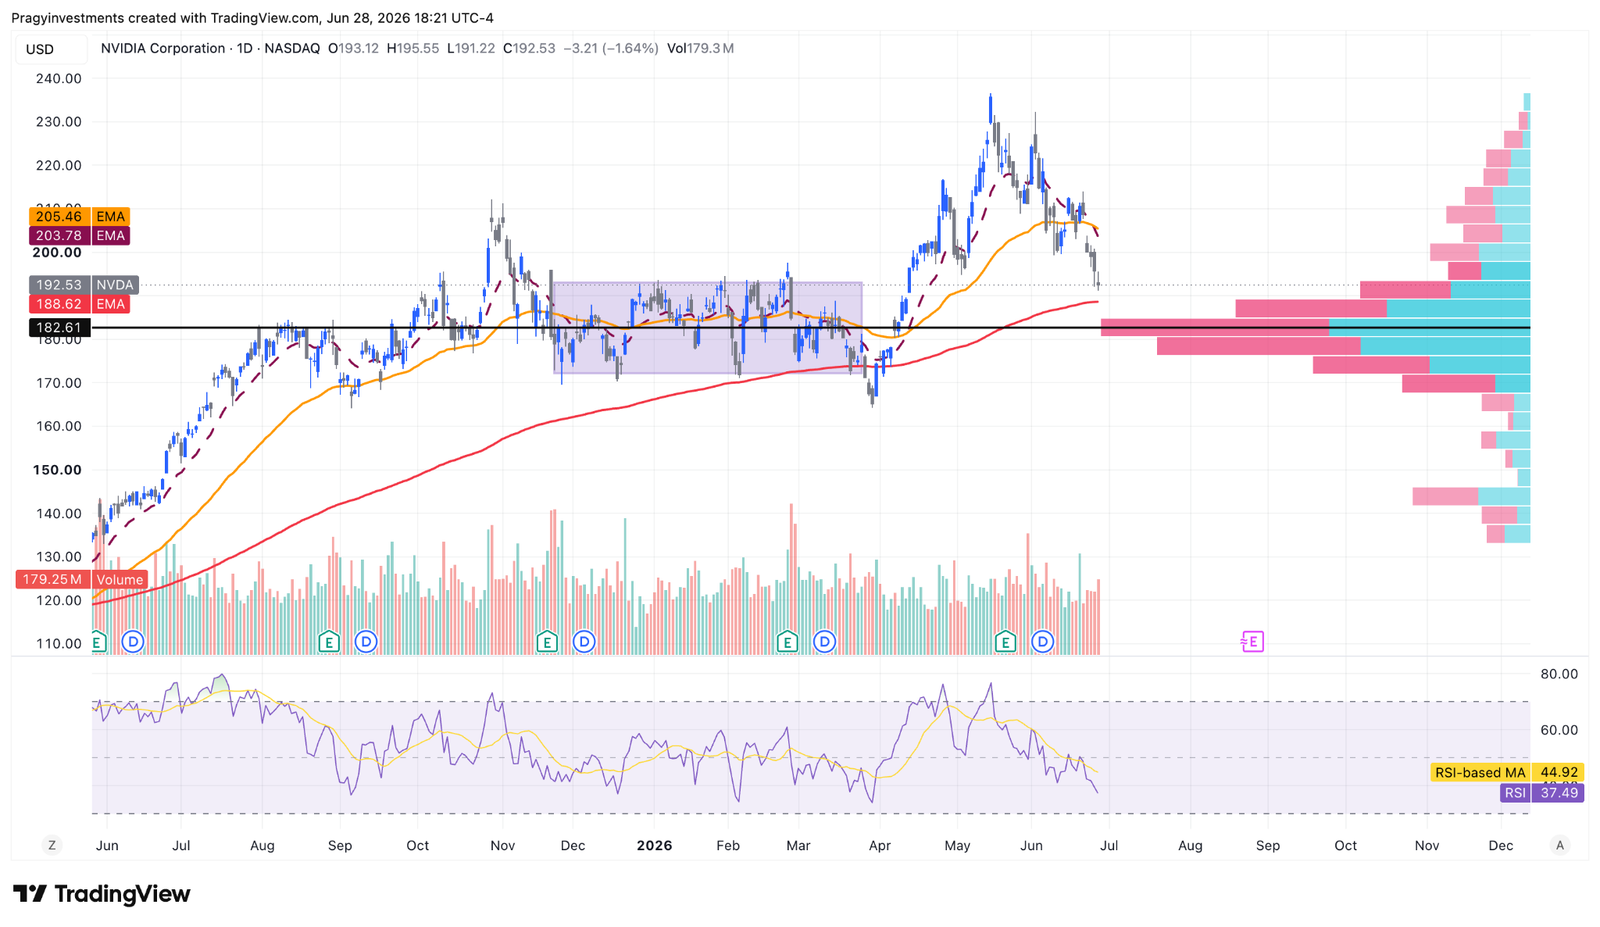
NVIDIA Corporation is approaching a high-confluence retest area after a sharp advance and a fast pullback from recent highs. The area under observation is built around the 200-day EMA, the top of a prior balance range, and a major visible volume node.
This is a watchlist setup, not a confirmed reversal. The structure becomes more constructive if buyers defend the 182.61–188.62 area and price begins to stabilize back above short-term moving-average resistance. It weakens if the retest area fails and price sustains below the prior balance top.
The official fundamental backdrop remains strong, led by record revenue, record Data Center revenue, high gross margins, and continued AI-infrastructure demand. The main risk is that expectations are already high, so technical weakness can matter even when the company’s operating results remain strong.
Setup Metadata
| Field | Detail |
|---|---|
| Ticker | NVDA |
| Company / Fund | NVIDIA Corporation |
| Market | U.S. / Nasdaq |
| Asset Type | Stock |
| Sector / Theme | Semiconductors / AI infrastructure / accelerated computing |
| Setup Type | High-confluence pullback retest |
| Timeframe | Daily swing / watchlist setup |
| Bias | Conditional bullish above support |
| Risk Level | High |
| Status | Watching / needs confirmation |
Thesis Snapshot
“The market believes NVDA’s recent pullback is pressuring a crowded AI-leadership trade; I believe the 182.61–188.62 area deserves close observation because it combines the 200-day EMA, the top of the prior balance, and a major volume node; the gap will close because a defended retest could reset sentiment while NVIDIA’s official results continue to show strong AI-infrastructure demand; I am wrong if price sustains below 182.61 and the retest area fails to attract demand.”
Technical Setup
NVDA is moving from a momentum-extension phase into a retest phase. The daily chart shows price pulling back toward a prior balance zone after failing to hold the short-term moving-average cluster near the 203.78–205.46 area.
The important feature of this setup is confluence. The 182.61–188.62 area combines three separate references: the 200-day EMA, the upper boundary of the prior balance, and a major volume node. When several independent references cluster in the same area, that zone becomes a useful research level because it can reveal whether prior demand remains active.
The setup still needs confirmation. Price is below the short-term moving-average cluster, and the RSI reading is below its RSI-based moving average on the supplied chart. That means momentum has not yet turned. A constructive response would involve stabilization near support, reduced downside follow-through, and an eventual reclaim of the 203.78–205.46 resistance area.
Failure to defend the retest area would change the interpretation. A sustained loss of 182.61 would move the setup from a constructive retest into a failed-support scenario.
Fundamental Snapshot
NVIDIA remains one of the strongest large-cap growth stories in the semiconductor market, but the stock’s technical setup should still be judged independently from the company’s long-term narrative.
For Q1 fiscal 2027, NVIDIA reported record revenue of $81.6 billion, up 85% year over year, and record Data Center revenue of $75.2 billion, up 92% year over year. GAAP gross margin was 74.9%, and the company’s Q2 fiscal 2027 outlook called for revenue of $91.0 billion, plus or minus 2%.
The longer-term official backdrop also remains strong. For fiscal 2026, NVIDIA reported full-year revenue of $215.9 billion, up 65% year over year. The Data Center business remains the central driver of the story, supported by accelerated computing, AI infrastructure, networking, and newer platform cycles.
Balance-sheet liquidity is also significant. NVIDIA’s Form 10-Q for the quarter ended April 26, 2026 reported $50.3 billion in cash, cash equivalents, and marketable debt securities, plus $30.2 billion of marketable equity securities.
The fundamental caution is that high growth comes with high expectations. NVIDIA’s filing also discusses dependence on data center availability, energy, capital, capacity commitments, product-transition execution, customer deployments, and export-control risk. For this market idea, the fundamental evidence supports why buyers may care about a major retest area, but it does not remove the need for technical confirmation.
Options Flow / Volume Clues
No specific options-flow details were included in this market idea. Because no options-flow data was supplied, no flow classification is assigned.
Options flow can reflect speculation, hedging, spreads, institutional positioning, or volatility exposure. It should not be treated as a standalone reason to buy or sell.
The chart-based volume clue is more relevant here: the retest area overlaps with a major visible volume node. That adds context because prior high-volume areas can act as decision zones where market participants reassess value. The volume node does not guarantee support, but it makes the 182.61–188.62 area more important to monitor.
Key Levels to Watch
| Level Type | Area / Level | Why It Matters |
|---|---|---|
| Support Area | 182.61–188.62 | High-confluence retest area combining the 200-day EMA, prior balance top, and major volume node. |
| Resistance Area | 203.78–205.46 | Short-term moving-average cluster where supply may reappear unless price reclaims the area. |
| Invalidation Area | Sustained loss below 182.61 | A failure below the prior balance top would weaken the retest thesis. |
| Upside Reference Area | 213–236 | Prior rally supply and recent high-zone reference if momentum improves. |
What Would Prove This Wrong
The technical setup is wrong if NVDA fails to defend the 182.61–188.62 support area and sustains below 182.61. That would suggest the prior balance top is no longer acting as a constructive retest zone.
The momentum read is wrong if price continues making lower highs below the 203.78–205.46 moving-average cluster and RSI remains weak. In that case, the retest would look less like a controlled pullback and more like a deeper distribution move.
The fundamental support case is wrong if future official results or guidance show a material slowdown in AI-infrastructure demand, margin deterioration, execution issues around platform transitions, or increasing pressure from export controls and capacity constraints.
The options-flow read is neutral for this article because no specific flow details were included.
Education Notes
A high-confluence retest is a research setup, not a prediction. The purpose of identifying a confluence zone is to define the area where the market’s response matters most.
Strong companies can still have weak charts, and weak charts can continue lower even when the fundamental story remains strong. For NVDA, the lesson is to separate business quality from setup confirmation. The company’s official results explain why the area matters, but price behavior near the retest zone determines whether the setup is improving or failing.
Key levels are reference points for market research. They are not instructions. The most important part of the setup is the invalidation framework, because it defines what would make the original idea less useful.
Source Notes
- NVIDIA Investor Relations: “NVIDIA Announces Financial Results for First Quarter Fiscal 2027,” dated May 20, 2026 — https://investor.nvidia.com/news/press-release-details/2026/NVIDIA-Announces-Financial-Results-for-First-Quarter-Fiscal-2027/default.aspx
- NVIDIA Investor Relations: “NVIDIA Announces Financial Results for Fourth Quarter and Fiscal 2026,” dated February 25, 2026 — https://investor.nvidia.com/news/press-release-details/2026/NVIDIA-Announces-Financial-Results-for-Fourth-Quarter-and-Fiscal-2026/default.aspx
- U.S. Securities and Exchange Commission: NVIDIA Form 10-Q, filed May 20, 2026, for the quarter ended April 26, 2026 — https://www.sec.gov/Archives/edgar/data/1045810/000104581026000052/nvda-20260426.htm
- Technical levels and chart context were supplied by the author from the uploaded NVDA chart image dated June 28, 2026.
Author and Conflict Disclosure
Disclosure: At the time of publication, the author holds a long position in NVDA and/or related instruments.
Disclaimer
This content is for financial education and market research only. It is not investment advice, financial planning, portfolio management, tax advice, legal advice, or a recommendation to buy, sell, or hold any security. Trading and investing involve risk, including possible loss of capital. Readers are responsible for their own decisions and should consult a qualified financial professional before making financial decisions.