
Quick Summary
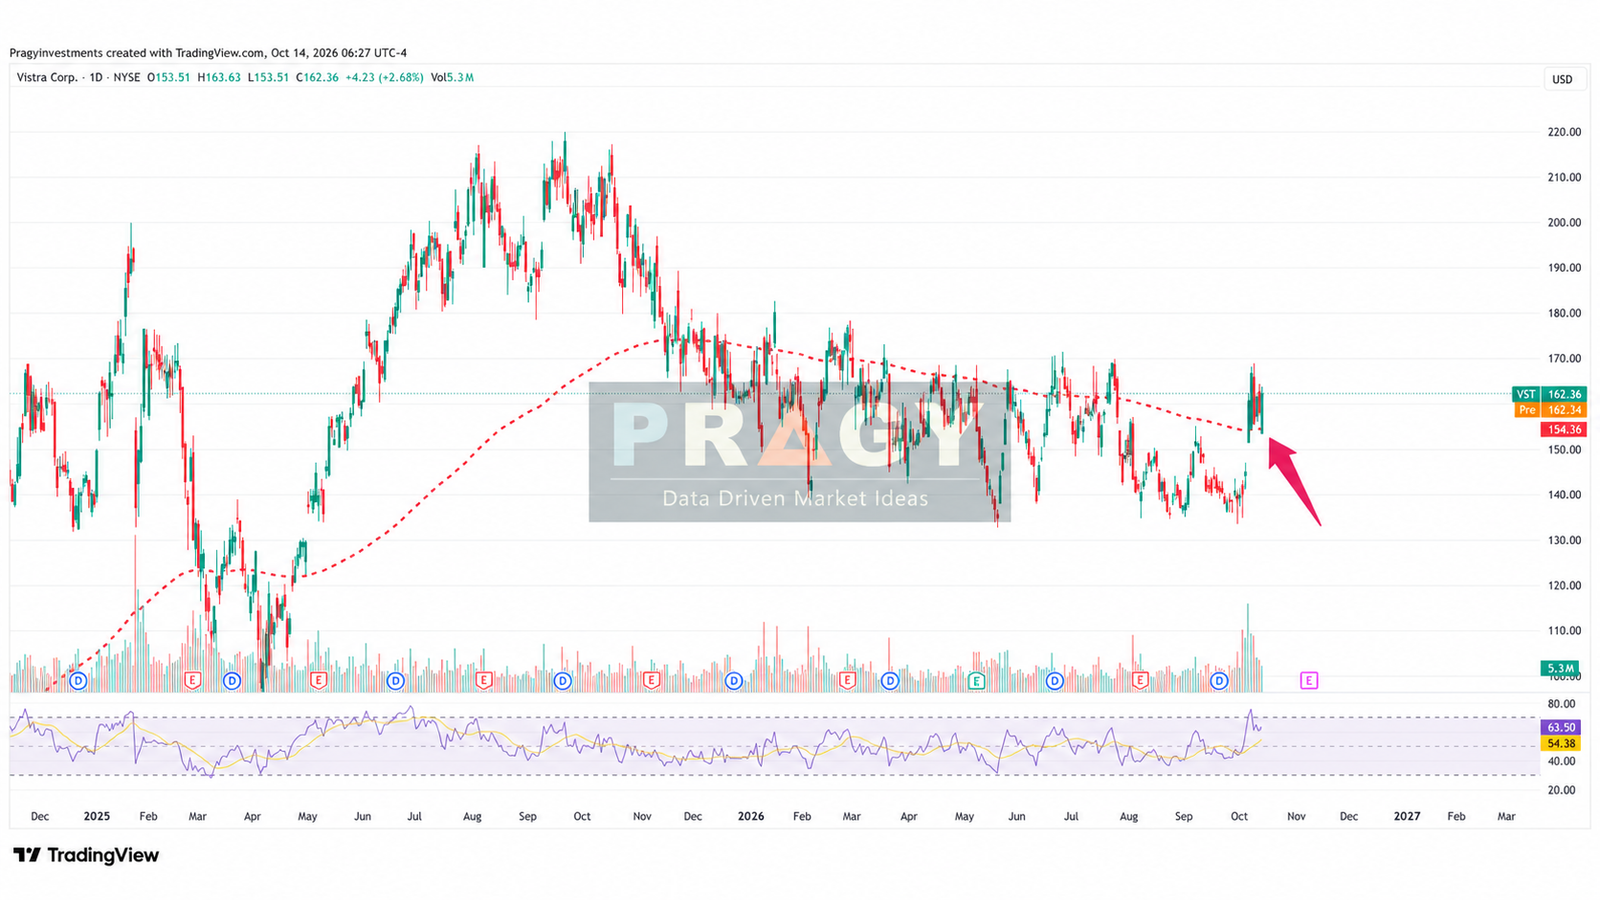
Vistra recovered from an October 13 low of $153.51 to a completed daily close of $162.36. That response reclaimed the prior breakout area around $154.90 and the daily 200-day moving averages. The supplied chart highlights this support recovery with an arrow near the latest candles.
The setup carries a conditional bullish bias. Price remains below nearby resistance, while the latest daily volume offers limited confirmation. This research uses completed regular-session daily data through October 13, 2026, and the completed week ending October 9. All prices are in U.S. dollars.
Setup Metadata
| Field | Detail |
|---|---|
| Ticker | VST — NYSE |
| Company | Vistra Corp. |
| Market / Currency | United States / USD |
| Asset Type | Stock |
| Sector / Theme | Utilities / independent power |
| Setup Type | 200-day support recovery and prior breakout retest |
| Timeframe | Daily setup with completed weekly context |
| Bias | Conditional bullish |
| Risk Level | Elevated |
| Status | Needs Confirmation |
Thesis Snapshot
The following expresses a conditional interpretation of price action; the first clause describes an inference about expectations.
“The market believes the recovery remains unproven, as inferred from price below recent highs; I believe the recovery of prior breakout support near the 200-day averages can support a conditional continuation thesis; the gap will close because holding support and building acceptance above resistance could establish a more durable recovery; I am wrong if price sustains a loss of $153.51 and fails to recover $154.90.”
Technical Setup
The earlier reference is the September 8 high of $154.90. VST closed above it at $160.50 on October 6. The October 13 session revisited that area, opening at its $153.51 low, reaching $163.63 and closing at $162.36. The close recovered both the 200-day exponential moving average at approximately $154.36 and the 200-day simple moving average at approximately $154.73.
These averages overlap the historical breakout reference, giving the support area several observable components. Both averages derive from the same price series, so their proximity should be treated as related evidence. They also move over time; the quoted values describe this observation date.
The daily recovery has yet to clear the October 13 high of $163.63 or the October 12 high of approximately $164.25. The October 8 swing high near $168.75 lies farther overhead. Completed closes above nearby resistance, followed by a durable hold, would strengthen the continuation case. Repeated rejection would weaken it.
Weekly context is constructive but incomplete as a trend-reversal argument. The week ending October 9 closed at $161.48, below the historical $171.35 high from the week of June 22–26. The currently forming week is excluded from confirmation.
Fundamental Snapshot
Vistra combines electricity generation with a retail electricity business. Its August 7, 2026, earnings release reported second-quarter net income of $305 million, down from $327 million a year earlier. Ongoing Operations Adjusted EBITDA, a non-GAAP measure, rose to $1.767 billion from $1.349 billion. Management attributed the improvement partly to realized power prices, capacity revenue and acquired plants; derivative valuation changes affected GAAP results.
The company reaffirmed its 2026 adjusted EBITDA range of $6.8 billion–$7.6 billion for ongoing operations. That dated guidance supplies business context rather than evidence that the chart must recover. Non-GAAP measures require their reconciliations and should be read alongside GAAP results. Vistra’s second-quarter release provides those details.
Vistra’s September 29 announcement schedules third-quarter results for November 6, 2026, with a conference call and webcast beginning at 10 a.m. ET. Earnings can change the operating outlook and price structure abruptly. Official event announcement.
Volume Clues
October 13 volume was approximately 5.30 million shares, about 0.75 times the preceding 20-session average. The recovery therefore lacks evidence of daily volume expansion. In contrast, the completed week ending October 9 recorded approximately 2.64 times its preceding 20-week average volume.
That earlier weekly participation adds context, while the latest day's quieter activity limits conviction. Volume alone cannot identify buyers, institutional intent or future direction.
Key Levels to Watch
| Level Type | Area / Level | Why It Matters |
|---|---|---|
| Support Area | $153.51–$154.90 | October 13 low and prior breakout reference, near the daily 200-day averages |
| Resistance Area | $163.63–$164.25; then $168.75 | Latest session high, October 12 high and October 8 swing high |
| Invalidation Area | Sustained loss of $153.51 with failed recovery of $154.90 | Would undermine the support-recovery thesis |
| Upside Reference Area | $171.35 | Historical weekly high; a reference if the recovery develops |
Levels are rounded to cents. The upside reference describes past price structure and carries no assurance of being revisited.
What Would Prove This Wrong
A sustained move below $153.51 followed by an unsuccessful recovery of $154.90 would contradict the central technical argument. Repeated failures beneath resistance would also reduce confidence, particularly if subsequent recoveries attract weak participation.
The business interpretation would weaken if future results or guidance showed deteriorating operating economics. Power prices, hedging outcomes, weather, regulation and operational execution warrant attention. A constructive historical earnings report cannot repair failed price structure by itself.
Education Notes
A support recovery is an observation about how price responded at a known area. Its durability becomes clearer through later completed sessions. Separating that response from an established breakout helps keep the research testable.
The useful lesson is to define both the evidence that would strengthen the thesis and the condition that would contradict it. These areas organize research and risk awareness; they are not personalized transaction instructions.
Source Notes
- Technical observations: the author’s supplied TradingView daily chart, captured October 14, 2026, and connected TradingView VST data. Calculations use regular-session, split-adjusted prices through October 13 and completed weekly data through October 9; volume comparisons exclude the observation period from their averages.
- Vistra Investor Relations: second-quarter 2026 earnings release, August 7, 2026; reporting period ended June 30, 2026.
- Vistra Investor Relations: third-quarter results announcement, September 29, 2026. Sources accessed October 14, 2026.
Author and Conflict Disclosure
Disclosure: The author and/or Pragy Investments may hold positions in the security or related instruments discussed. Any such exposure does not alter the educational and market-research purpose of this content.
Disclaimer
This content is for financial education and market research only. It is not investment advice, financial planning, portfolio management, tax advice, legal advice, or a recommendation to buy, sell, or hold any security. Trading and investing involve risk, including possible loss of capital. Readers are responsible for their own decisions and should consult a qualified financial professional before making financial decisions.