
Quick Summary
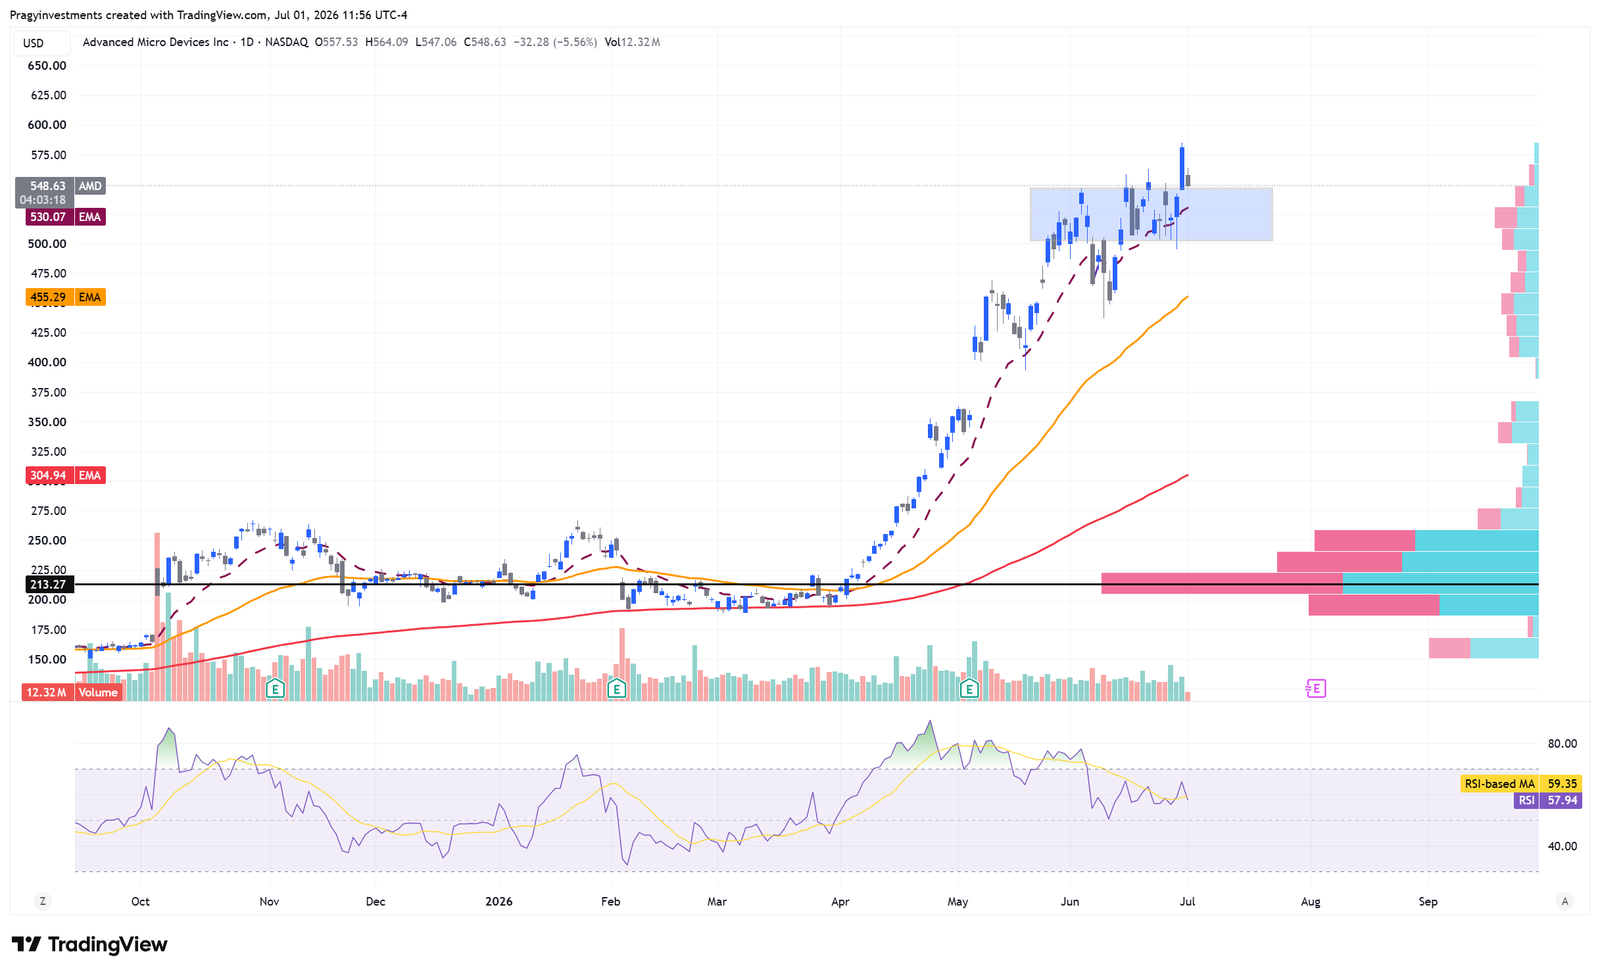
AMD is being framed as a high-risk breakout-retest setup after a sharp move higher. The core question is whether the prior resistance zone near $500–$545/$550 can now act as support. The setup remains constructive while AMD holds the $530–$545/$550 support region, but it still needs price confirmation because the move is extended and options flow does not currently add independent confirmation.
Near-term resistance sits around $565–$580. A clean move above $581+ would strengthen the continuation case, while a swing failure below $528–$530 would weaken the setup and a break below $500 would cause larger thesis damage.
Setup Metadata
| Field | Detail |
|---|---|
| Ticker | AMD |
| Company / Fund | Advanced Micro Devices, Inc. |
| Market | U.S. / NASDAQ |
| Asset Type | Stock |
| Sector / Theme | Semiconductors / AI infrastructure / data center CPUs and GPUs / high-performance computing |
| Setup Type | Breakout retest / Continuation |
| Timeframe | Swing Watch / Long-Term Research |
| Bias | Bullish above support; cautious below $530 |
| Risk Level | High |
| Status | Needs Confirmation |
Thesis Snapshot
“The market believes AMD’s breakout has shifted the former resistance zone into a potential support area; I believe the setup remains constructive only if the $530–$545/$550 band holds; the gap will close because official results continue to support the AI infrastructure and data-center growth narrative while price confirms whether demand remains active at the retest zone; I am wrong if AMD loses $528–$530 on a swing basis, with larger thesis damage below $500.”
Technical Setup
AMD appears to have broken above its prior consolidation range and is now retesting the breakout area. The important technical question is whether the former resistance zone around $500–$545/$550 can transition into support.
The first support area is $545–$550. A stronger support reference sits around $530–$535, which also aligns with the chart’s shorter-term moving-average area. That makes the $530–$545/$550 region the main zone to watch for confirmation.
The setup remains extended after a sharp advance, so the bullish case should not be treated as confirmed simply because price moved higher. A constructive retest would require price to stabilize above support and then challenge the $565–$580 resistance area. A clean breakout above $581+ would be the main continuation reference.
A swing failure below $528–$530 would suggest the retest is not holding. A deeper move below $500 would do broader damage to the breakout thesis because it would place AMD back under the former resistance area.
Fundamental Snapshot
AMD’s latest official materials support the AI infrastructure and data-center narrative behind this setup. In Q1 2026, AMD reported total revenue of $10.253 billion, up 38% year over year. The Data Center segment reported $5.775 billion of revenue, up 57% year over year, with management attributing the strength primarily to demand for 5th generation AMD EPYC processors and AMD Instinct MI350 Series GPUs.
The Client and Gaming segment reported $3.605 billion of revenue, up 23% year over year, while Embedded revenue was $873 million, up 6% year over year. GAAP gross margin improved to 53% from 50% in the prior-year period, and AMD’s Q2 2026 outlook called for revenue of approximately $11.2 billion, plus or minus $300 million, with non-GAAP gross margin expected to be approximately 56%.
That fundamental backdrop supports the research narrative, but it does not remove the risk in the chart. AMD’s official filing also highlights intense competition, semiconductor cyclicality, uncertainty around the pace of generative AI demand, and possible data-center capacity, power, construction, and customer-financing constraints. Because the stock has already moved sharply, the chart still needs to hold the retest zone for the thesis to stay constructive.
Options Flow / Volume Clues
Options flow does not currently add confirmation to this market idea.
Options flow can reflect speculation, hedging, spreads, institutional positioning, or volatility exposure. It should not be treated as a standalone reason to be bullish or bearish. Based on the supplied flow data, this is a chart-led and fundamentals-supported watchlist idea rather than a flow-confirmed setup.
Flow classification: Watchlist.
Key Levels to Watch
| Level Type | Area / Level | Why It Matters |
|---|---|---|
| Support Area | $545–$550 first support; $530–$535 stronger support / 20 EMA area | This is the retest zone where prior resistance needs to act as support. |
| Resistance Area | $565–$580 | This is the near-term supply area that price needs to clear to strengthen continuation. |
| Invalidation Area | Below $528–$530 swing invalidation; larger thesis damage below $500 | A move below this region would suggest the breakout retest is failing. |
| Upside Reference Area | $565–$580 first reference; $581+ continuation reference | This is the next area of interest if momentum improves above the retest zone. |
What Would Prove This Wrong
The technical thesis weakens if AMD loses the $528–$530 area on a swing basis. The larger breakout thesis would be more damaged below $500 because price would be back under the prior resistance zone.
The fundamental thesis would weaken if official results show a material slowdown in Data Center growth, deterioration in margins, weaker AI accelerator demand, or guidance that no longer supports the AI infrastructure growth narrative.
The narrative would also weaken if competition, export controls, data-center capacity limits, power constraints, construction delays, or customer financing limits begin to weigh more visibly on AMD’s growth outlook.
Options flow is not confirming this idea today. A lack of bullish flow by itself does not invalidate the setup, but weak flow alongside a loss of support would reduce the quality of the watchlist case.
Education Notes
This setup is a useful reminder that strong fundamentals and a strong chart move are not the same as confirmation. A breakout retest needs evidence that the prior resistance area is becoming support.
Key levels are research references, not instructions. The most important part of this idea is the invalidation framework: if price cannot hold the retest zone, the thesis changes.
Options flow can add context, but it should not replace price structure or official fundamental evidence. In this case, the flow data does not add confirmation, so the setup should be viewed primarily through the chart and AMD’s official business results.
Source Notes
- Advanced Micro Devices Investor Relations: AMD Reports First Quarter 2026 Financial Results, press release dated May 5, 2026.
- U.S. Securities and Exchange Commission: Advanced Micro Devices, Inc. Form 10-Q, quarterly report for the quarter ended March 28, 2026, filed May 6, 2026.
- Technical levels, chart interpretation, and options-flow details were supplied by the author and interpreted as educational market-research context only.
Author and Conflict Disclosure
Disclosure: The author and/or Pragy Investments may hold positions in the security or related instruments discussed. Any such exposure does not alter the educational and market-research purpose of this content.
Disclaimer
This content is for financial education and market research only. It is not investment advice, financial planning, portfolio management, tax advice, legal advice, or a recommendation to buy, sell, or hold any security. Trading and investing involve risk, including possible loss of capital. Readers are responsible for their own decisions and should consult a qualified financial professional before making financial decisions.