
Quick Summary
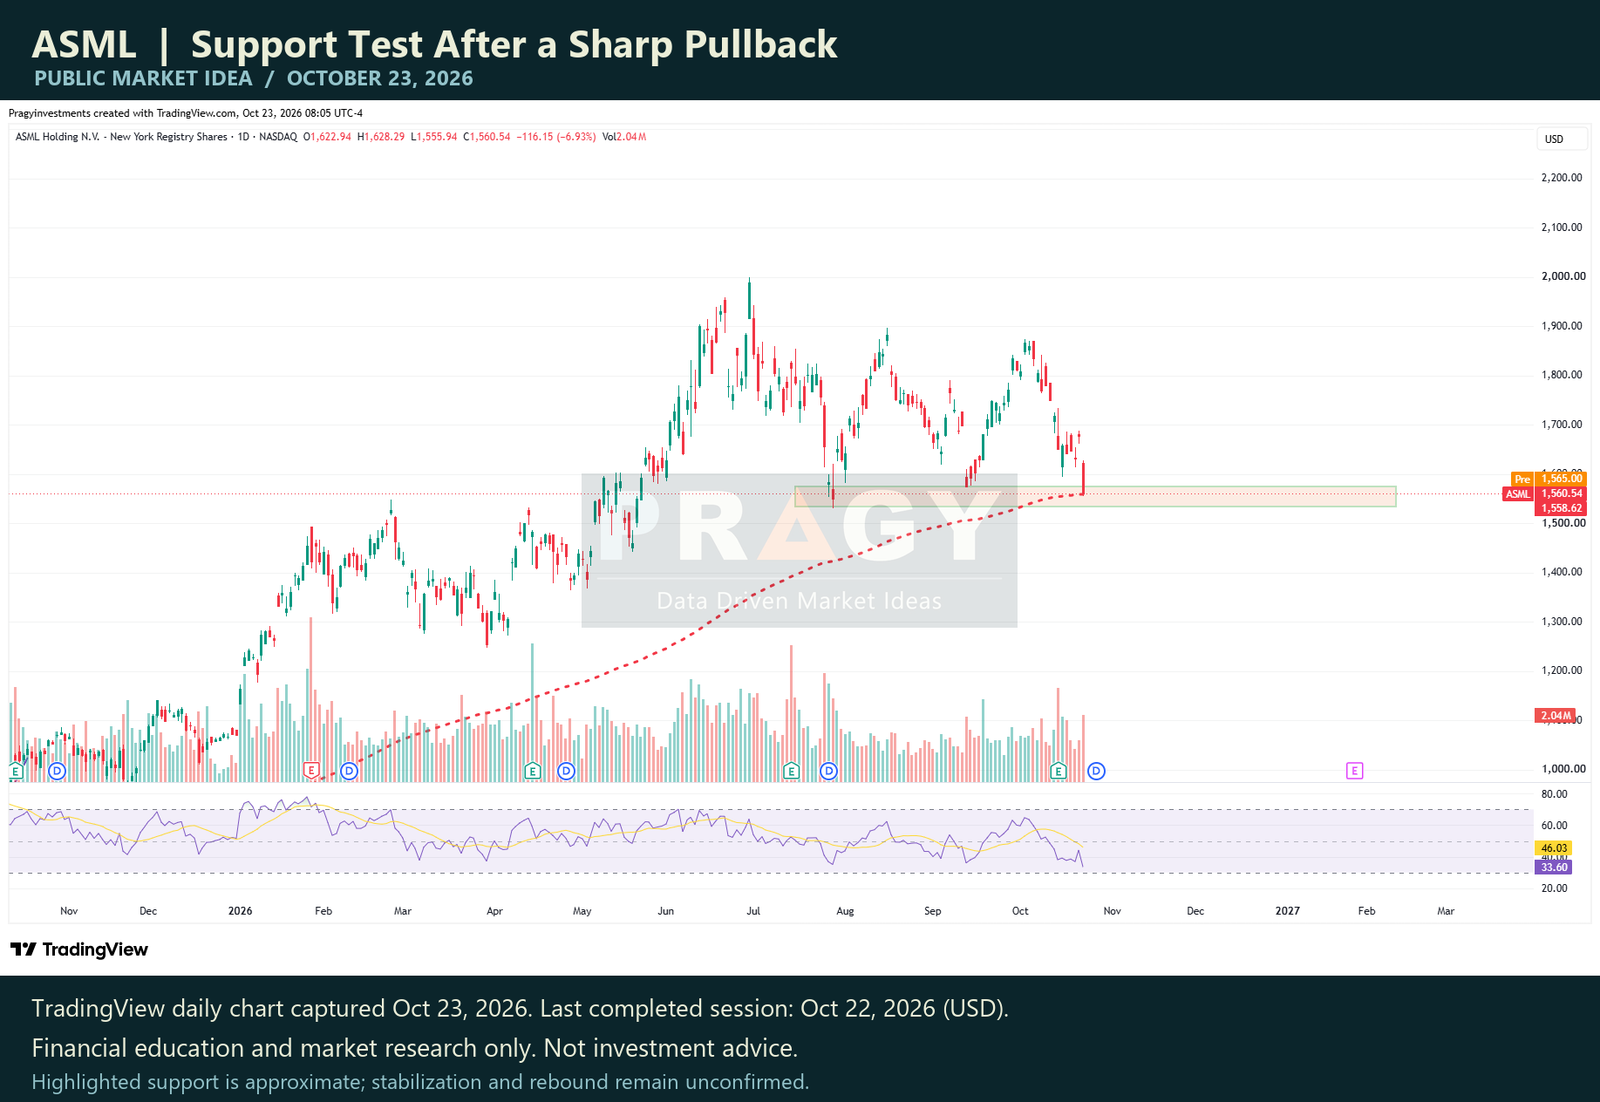
ASML's October 22, 2026 completed daily close was $1,560.54, down 6.93%. That decline carried the Nasdaq-listed U.S.-dollar shares below prior daily support and the independently calculated 200-day simple moving average. It also brought price into the highlighted support area on the accompanying chart.
The central question is whether approximately $1,535–$1,575 can stabilize the pullback. The calculated 200-day exponential moving average, $1,558.62, sits inside that broad area. Price finished slightly above it, so an EMA breakdown is not established by this close. A rebound remains possible, while a failure of the area would strengthen the case for further weakness. This is a high-risk support test that needs confirmation, rather than an established reversal. TradingView technical source
Setup Metadata
| Field | Detail |
|---|---|
| Ticker | ASML — Nasdaq-listed shares, USD |
| Company | ASML Holding N.V. |
| Market | U.S. |
| Asset Type | Stock |
| Sector / Theme | Semiconductor equipment |
| Setup Type | Support test after daily breakdown |
| Timeframe | Daily; completed weekly context through October 16, 2026 |
| Bias | Conditional support test after daily weakness |
| Risk Level | High |
| Status | Needs Confirmation |
| Research Date | October 23, 2026 |
| Completed Daily Observation | October 22, 2026 |
Thesis Snapshot
The opening clause interprets recent price action; it does not describe every participant's beliefs.
“The market believes the recent advance is losing durability, as suggested by the daily support breakdown; I believe the highlighted support area near the calculated 200-day EMA is a decision point where stabilization and further weakness both remain plausible; the gap will close because subsequent completed closes can show whether this area holds and broken support is reclaimed or the area fails; I am wrong if stabilization fails below $1,530.64, while a sustained reclaim above $1,594.03 weakens the continued-breakdown branch.”
Technical Setup
The accompanying chart was captured on October 23 at 08:05 Eastern time. Its last completed regular-session daily candle is October 22. Any premarket label on the image is a separate observation, not the completed close used for this research.
Three observations frame the daily weakness: the $1,560.54 close is below the prior 50-session low of $1,572.84, the prior 20-session low of $1,594.03, and the calculated 200-day SMA at $1,586.27. Those prior-window lows exclude the October 22 candle. Together they define an overhead reclaim area, rather than a guarantee that resistance will hold.
The highlighted support band is a visual approximation of $1,535–$1,575, not an exact measurement of the rectangle's boundaries. The separately calculated 200-day EMA at $1,558.62 provides a nearby reference. The chart's dotted line is unlabeled; its indicator settings are not inferred from its appearance. No numerical RSI claim is needed for the thesis.
A constructive response would involve price stabilizing within the band and subsequently reclaiming broken daily support on sustained closing evidence. A brief intraday move above one reference would provide less evidence than a recovery that persists. Conversely, closing weakness through the band would argue against treating its presence as sufficient support.
The last completed weekly observation ends October 16, when the older $1,530.64 support reference was still intact. The week containing October 23 is incomplete at the chart's capture time. Daily weakness therefore does not establish a completed weekly breakdown. TradingView technical source
Fundamental Snapshot
ASML reported third-quarter 2026 results on October 14, for the quarter ended September 27. Its release reported approximately €11.662 billion in net sales, a 57.5% gross margin, and €4.960 billion in net income. The company guided full-year 2026 revenue to €44–€45 billion; that guidance is forward-looking, rather than a realized result. ASML Q3 2026 earnings release
Those reported results and the outlook are a meaningful counterargument to a one-sided bearish reading of the chart. They do not establish that the share price must rebound. Equally, a weak daily candle does not by itself establish deteriorating operations. No verified cause for the October 22 decline is assigned here. Changes in demand expectations or the operating outlook could alter the research case independently of chart levels.
Volume Clues
October 22 volume was approximately 2.04 million shares, or 1.38 times the mean of the preceding 20 completed sessions. That adds participation context to the decline, but it does not identify who traded, why they traded, or whether selling will continue. These are share-volume observations, not options-flow evidence. TradingView technical source
Key Levels to Watch
All price references below are USD for the Nasdaq listing. The highlighted band is approximate; calculated and observed references are rounded for readability.
| Level Type | Area / Level | Why It Matters |
|---|---|---|
| Support Area | Approximately $1,535–$1,575 | Highlighted chart area being tested; the calculated $1,558.62 EMA lies within it. Support can fail. |
| Resistance Area | $1,572.84–$1,594.03 | Broken daily support references, with the calculated $1,586.27 SMA inside the area. This partly overlaps the approximate support band's upper edge. |
| Invalidation Area | $1,530.64 | A confirmed close below this older weekly reference challenges the stabilization branch. Separately, a sustained daily reclaim above $1,594.03 challenges continued breakdown. |
| Upside Reference Area | $1,628.29–$1,687.81 | The observed October 22 and October 21 daily highs provide conditional recovery references if support stabilizes and overhead resistance is reclaimed. They are not forecasts. |
What Would Prove This Wrong
The stabilization branch weakens if price loses the highlighted band and records a confirmed close below $1,530.64. A decisive loss followed by an unsuccessful recovery would provide stronger evidence than a fleeting intraday breach.
The continued-breakdown branch weakens if ASML sustains a daily reclaim above $1,594.03, rather than merely touching the area. That would recover both broken-support references and the calculated SMA cited in this analysis, although the moving average itself will change with later observations.
A material change to ASML's operating outlook would also require a reassessment. Neither the support rectangle nor a moving average can protect against gaps or new information. The branches describe conditions for research, not trade instructions.
Education Notes
A support area is a place to study price behavior, not proof that demand will prevail. The distinction matters after a large down day: the decline can continue, but a sharp rebound near longer-term references can also make a late bearish conclusion unreliable.
An EMA and an SMA weight historical prices differently, so being below one while remaining slightly above the other is possible. Timeframes also differ: daily support can fail while the most recent completed weekly structure remains intact. Keeping dates and confirmation conditions explicit is more useful than treating either chart as a prediction.
Source Notes
- ASML Investor Relations — Q3 2026 financial results, earnings release dated October 14, 2026; reporting quarter ended September 27, 2026. Used for reported revenue, gross margin, net income and forward-looking annual guidance. Official earnings release
- ASML Investor Relations — Share information, accessed October 23, 2026. Used to distinguish the Nasdaq U.S.-dollar share line from the Amsterdam euro listing. Official share information
- TradingView — NASDAQ:ASML, completed regular-session daily observations through October 22, 2026 and weekly observations through October 16, 2026. Prices are split-adjusted only. Moving averages, prior-window references and relative volume were calculated from retained TradingView OHLCV observations; they are not claims about the settings of an unlabeled chart indicator. The accompanying chart was captured October 23, 2026 at 08:05 Eastern time. Actual upstream technical source
Author and Conflict Disclosure
Disclosure: The author and/or Pragy Investments may hold positions in the security or related instruments discussed. Any such exposure does not alter the educational and market-research purpose of this content.
Disclaimer
This content is for financial education and market research only. It is not investment advice, financial planning, portfolio management, tax advice, legal advice, or a recommendation to buy, sell, or hold any security. Trading and investing involve risk, including possible loss of capital. Readers are responsible for their own decisions and should consult a qualified financial professional before making financial decisions.