
Quick Summary
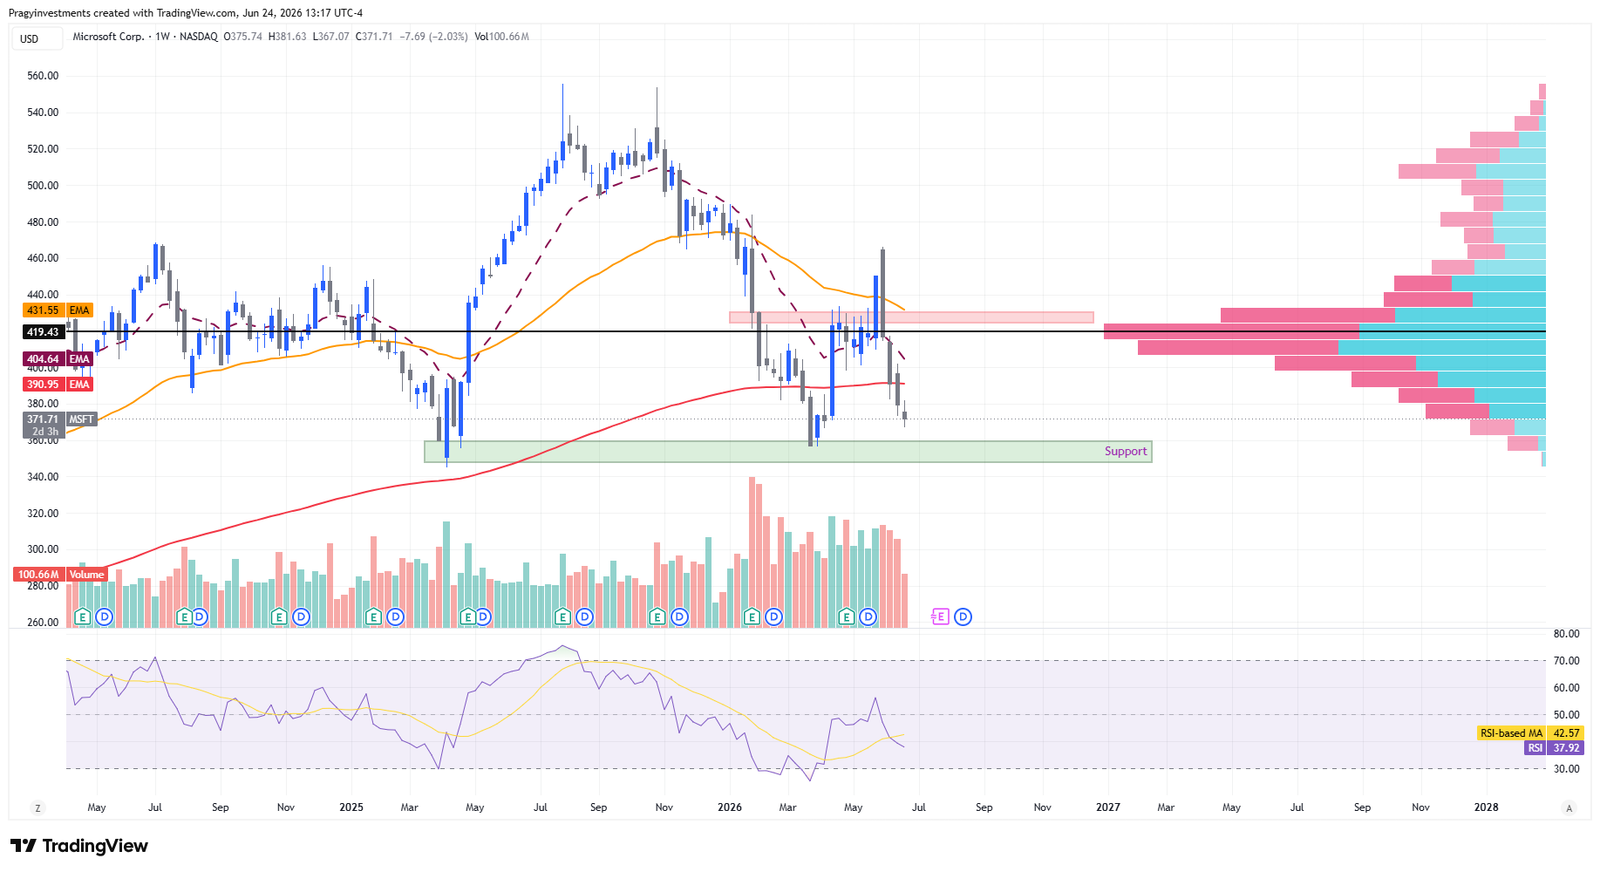
Microsoft is approaching a major weekly support area at $350–$360 after a sustained pullback. The supplied chart shows MSFT near $371.71 and below several plotted weekly moving-average references, so the setup is not yet confirmed. A defense of support followed by a reclaim of $390–$405 would improve the structure; a sustained weekly close below $345 would weaken the thesis. The High / Speculative label reflects the technical condition and confirmation risk, not Microsoft’s business maturity.
Setup Metadata
| Field | Detail |
|---|---|
| Ticker | MSFT |
| Company / Fund | Microsoft Corporation |
| Market | U.S. |
| Asset Type | Stock |
| Sector / Theme | Technology / Cloud, Enterprise Software, and AI Infrastructure |
| Setup Type | Pullback |
| Trend View | Intermediate-term weekly downtrend; longer-term structure under pressure |
| Timeframe | Educational / Swing Watch |
| Bias | Watching / Bullish above support |
| Risk Level | High / Speculative |
| Status | Watching / Needs Confirmation |
Thesis Snapshot
“The market believes Microsoft’s cloud and AI momentum is not enough to prevent further technical deterioration; I believe the $350–$360 weekly support area can become a stabilization zone; the gap will close because sustained Azure and Microsoft Cloud growth, strong operating cash generation, and a reclaim of $390–$405 could improve market perception; I am wrong if MSFT sustains a weekly close below $345 or if cloud growth and operating leverage weaken materially.”
Technical Setup
MSFT is in an intermediate-term weekly downtrend, with its longer-term structure under pressure. The supplied chart shows lower highs from the late-2025 peak and price below plotted weekly moving-average references near $391, $405, and $432. The $350–$360 region corresponds to prior weekly demand and the marked support band.
Because price remains above that band, this is an approach-to-support watch rather than a confirmed support bounce. The setup would strengthen if buyers defend $350–$360, weekly price action begins to stabilize, and MSFT reclaims the $390–$405 resistance area. The displayed weekly RSI is near 38, below the neutral 50 level, so momentum has not yet confirmed a durable reversal.
The $419–$431 area is an upside reference only if momentum and price structure improve. Until then, overhead supply and the series of lower highs keep the setup in Watching / Needs Confirmation status.
Fundamental Snapshot
Microsoft operates through Productivity and Business Processes, Intelligent Cloud, and More Personal Computing. Its principal drivers include Microsoft 365, Azure and other cloud services, LinkedIn, Dynamics, Windows, gaming, search, security, developer tools, and AI-enabled products.
For the fiscal 2026 third quarter ended March 31, 2026, Microsoft reported revenue of $82.9 billion, up 18% year over year; operating income of $38.4 billion, up 20%; and net income of $31.8 billion, up 23%. Microsoft Cloud revenue increased 29% to $54.5 billion, while Azure and other cloud services revenue increased 40%. These results support the fundamental case that cloud and AI demand remains a major growth engine.
The main counterweight is capital intensity. Microsoft generated $46.7 billion of operating cash flow during the quarter, while additions to property and equipment reached $30.9 billion. At March 31, 2026, cash, cash equivalents, and short-term investments totaled $78.3 billion, compared with $31.4 billion of long-term debt. Microsoft also returned $10.2 billion to shareholders through dividends and share repurchases during the quarter.
AI infrastructure spending is pressuring profitability at the margin. Microsoft reported that its cloud gross-margin percentage declined to 66%, primarily because of continued AI infrastructure investment and growing AI product usage, partly offset by efficiency gains. The fundamental question is therefore not whether Microsoft is growing, but whether future cloud and AI monetization can justify the scale and duration of current infrastructure spending.
Key Levels to Watch
| Level Type | Area / Level | Why It Matters |
|---|---|---|
| Support Area | $350–$360 | Marked weekly demand area that buyers would need to defend |
| Resistance Area | $390–$405 | Contains overhead moving-average references and the first area where supply may reappear |
| Invalidation Area | Sustained weekly close below $345 | Would break beneath the support structure and materially weaken the setup |
| Upside Reference Area | $419–$431 | Prior price and volume interest plus a higher moving-average area if momentum improves |
What Would Prove This Wrong
Technical: A sustained weekly close below $345 would invalidate the support-based thesis. Repeated failures to stabilize around $350–$360 would also show that the marked demand area is not holding.
Fundamental: A material slowdown in Azure or Microsoft Cloud growth, continued cloud-margin compression without corresponding operating leverage, or infrastructure spending rising faster than the cash returns generated from that investment would weaken the fundamental support for the setup.
Narrative: If MSFT tests support but cannot reclaim $390–$405 and continues forming lower highs, the market would still be treating rallies as opportunities for supply rather than evidence of a durable recovery.
Education Notes
A strong company can still have a weak technical setup. Support is an area to observe, not proof that a reversal has begun. Confirmation comes from how price behaves around the level, whether momentum improves, and whether overhead resistance can be reclaimed.
The key levels in this note are research references rather than instructions. The invalidation condition matters because it defines when the support thesis no longer matches the observed price structure.
Source Notes
- Microsoft Investor Relations: Microsoft 2025 Annual Report, for business segments and revenue drivers.
- Microsoft Investor Relations: Microsoft Cloud and AI Strength Fuels Third Quarter Results, fiscal 2026 third-quarter earnings release dated April 29, 2026.
- Microsoft Investor Relations: FY26 Q3 Performance, dated April 29, 2026.
- U.S. Securities and Exchange Commission: Microsoft Corporation Form 10-Q, quarter ended March 31, 2026, filed April 29, 2026.
- Technical levels and chart observations are based on the author-supplied weekly MSFT chart captured June 24, 2026.
Author and Conflict Disclosure
Disclosure: The author and/or Pragy Investments may hold positions in the security or related instruments discussed. Any such exposure does not alter the educational and market-research purpose of this content.
Disclaimer
This content is for financial education and market research only. It is not investment advice, financial planning, portfolio management, tax advice, legal advice, or a recommendation to buy, sell, or hold any security. Trading and investing involve risk, including possible loss of capital. Readers are responsible for their own decisions and should consult a qualified financial professional before making financial decisions.