
Quick Summary
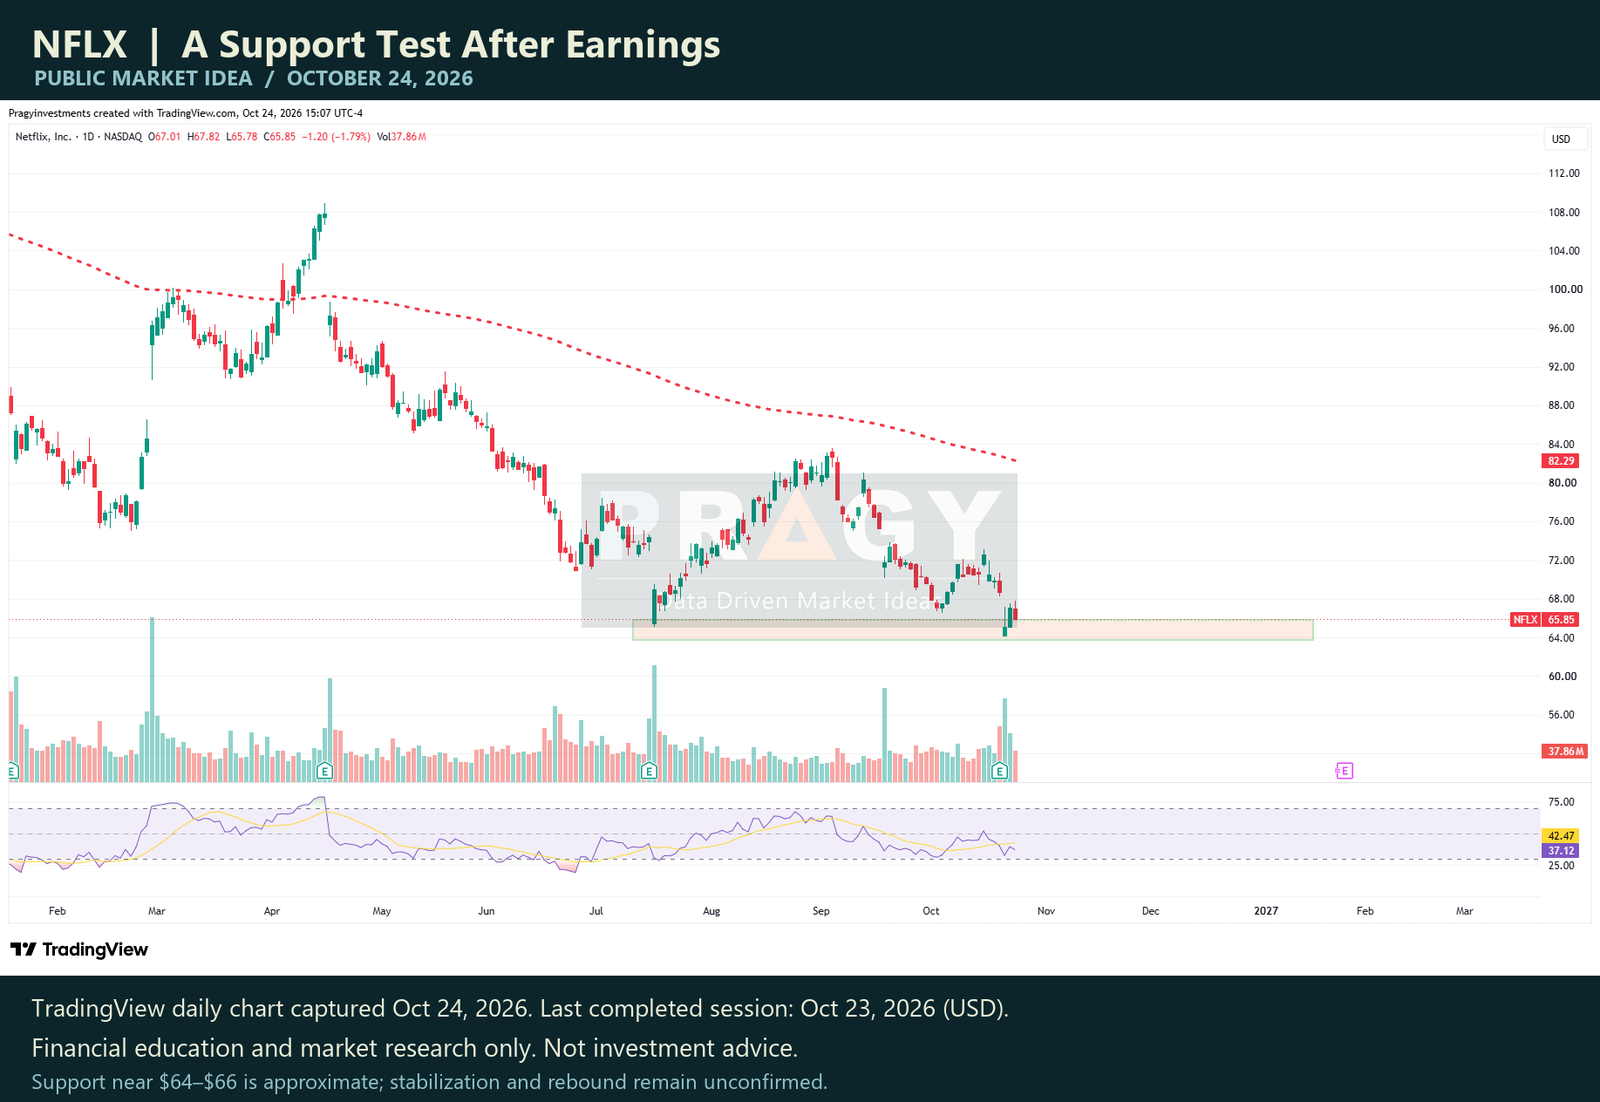
Netflix finished the October 23, 2026 regular session at $65.85, inside the approximate $64–$66 support area highlighted on the accompanying daily chart. The chart was captured on October 24; that weekend capture does not represent a new trading session.
The research question is whether this familiar area can stabilize a prolonged decline. A sustained recovery through observed resistance would improve the structure, while further completed-price weakness below the lower edge would challenge stabilization. Neither a reversal nor a horizontal support breakdown is established. This remains a high-risk support watch. Yahoo historical price source
Setup Metadata
| Field | Detail |
|---|---|
| Ticker | NFLX — Nasdaq-listed common stock, USD |
| Company | Netflix, Inc. |
| Market | U.S. |
| Asset Type | Stock |
| Sector / Theme | Entertainment and streaming |
| Setup Type | Support test after earnings |
| Timeframe | Daily; completed weekly context through October 23, 2026 |
| Bias | Neutral support watch within a broader downtrend |
| Risk Level | High |
| Status | Needs Confirmation |
| Research Date | October 24, 2026 |
| Completed Price Observation | October 23, 2026 |
Thesis Snapshot
The opening clause interprets recent price action; it does not describe every participant's beliefs.
“The market believes recent weakness warrants caution about Netflix's near-term outlook; I believe the approximately $64–$66 area is a useful test rather than evidence of a confirmed reversal; the gap will close because subsequent completed closes can show whether support holds and recovery develops or the area fails; I am wrong if sustained completed closes below approximately $64 undermine stabilization.”
Technical Setup
The accompanying chart shows a prolonged daily decline and a return to the highlighted support area. The approximate band describes the visual region, rather than exact boundary settings. Within it, $64.10 is the observed October 21 low, while $65.08 is a prior weekly low. The completed October 19–23 weekly close of $65.85 remained above $65.08. Trading through an older low during the week is different from closing below it.
A fresh completed close below $64.10 would indicate additional local weakness. Sustained closes below the approximate $64 lower edge would more seriously undermine the support-watch thesis. Conversely, recovery through the October 23 high of $67.82, followed by the latest completed weekly high of $70.66, would improve the near-term structure. These are observed reference prices, not a forecast that recovery will occur.
The indicator settings on the chart are not visible, so this analysis does not assign a period or type to its dotted line or lower-panel indicators. It also makes no quantitative volume claim. The support framework rests on price and completed closes. Historical price source
Fundamental Snapshot
Netflix's October 20 shareholder letter, covering the quarter ended September 30, reported $12.874 billion in revenue, 11.8% year-over-year growth and a 34.6% operating margin. The letter attributed the margin's outperformance against its forecast primarily to expense timing and a slight revenue benefit. Those operating results provide a counterargument to treating the weak chart as evidence that the business has stopped growing.
There is also uncertainty. Netflix reduced its expected 2026 advertising revenue to approximately $2.7 billion, compared with approximately $3 billion previously, citing a slower-than-expected rollout of some advertising capabilities. This is management's outlook, not a realized annual result. The combination of reported growth and a reduced advertising outlook supports a balanced research view; it does not establish a single cause for the share-price decline. Netflix Q3 2026 shareholder letter
The Federal Reserve calendar lists an October 27–28 FOMC meeting. It adds near-term market uncertainty without determining how NFLX will respond at support. No policy outcome is assumed. Federal Reserve calendar
Key Levels to Watch
| Level Type | Area / Level | Why It Matters |
|---|---|---|
| Support Area | Approximately $64–$66 | Highlighted chart region containing the observed $64.10 local low and $65.08 prior weekly low. |
| Resistance Area | $67.82–$70.66 | Observed daily and weekly highs; a recovery would need to work through these references. |
| Invalidation Area | $64–$64.10 | A close below $64.10 shows local deterioration; sustained closes below the approximate $64 floor challenge stabilization of the broader area. |
| Upside Reference Area | $70.66–$73.07 | The latest weekly high and prior 20-day high become relevant only if recovery develops. They are not projected outcomes. |
What Would Prove This Wrong
The stabilization branch weakens after a fresh completed close below $64.10 and fails more clearly if completed closes persist below the approximate $64 lower edge. A brief intraday move and a sustained closing failure are different observations.
The contrary case also matters: repeated support holds followed by recovery through $67.82 and then $70.66 would weaken a simple downside-continuation interpretation. Stronger operating execution would be relevant context, but fundamental growth alone cannot establish a technical reversal. Likewise, future deterioration in reported operating trends could reduce confidence in a recovery thesis.
Education Notes
- A support area is a place to study market response, not a promise of a rebound.
- A strong reported quarter and a weak price trend can coexist. They answer different research questions.
- Completed closes help distinguish an intraday test from a sustained loss of structure.
- Key levels are conditional research references. No personalized trading action follows from them.
Source Notes
- Yahoo Finance: NFLX historical prices, completed daily observations through October 23, 2026 and completed weekly observations through October 19–23. Numerical price references use Yahoo OHLCV; displayed prices are rounded to cents.
- TradingView: the accompanying NFLX daily chart was captured October 24, 2026 at 15:07 UTC−4 and shows the October 23 completed session. The highlighted support region is read approximately from that chart. NFLX instrument page. The chart and Yahoo calculations have separate source origins; quantitative volume comparisons are not used.
- Netflix Investor Relations: Q3 2026 Shareholder Letter, dated October 20, 2026, quarter ended September 30, 2026, pages 1–2. Reported results are distinguished from management's advertising outlook.
- Federal Reserve: FOMC meeting calendars, accessed October 24, 2026; the scheduled October 27–28 meeting is presented as event risk.
Author and Conflict Disclosure
Disclosure: The author and/or Pragy Investments may hold positions in the security or related instruments discussed. Any such exposure does not alter the educational and market-research purpose of this content.
Disclaimer
This content is for financial education and market research only. It is not investment advice, financial planning, portfolio management, tax advice, legal advice, or a recommendation to buy, sell, or hold any security. Trading and investing involve risk, including possible loss of capital. Readers are responsible for their own decisions and should consult a qualified financial professional before making financial decisions.