
Quick Summary
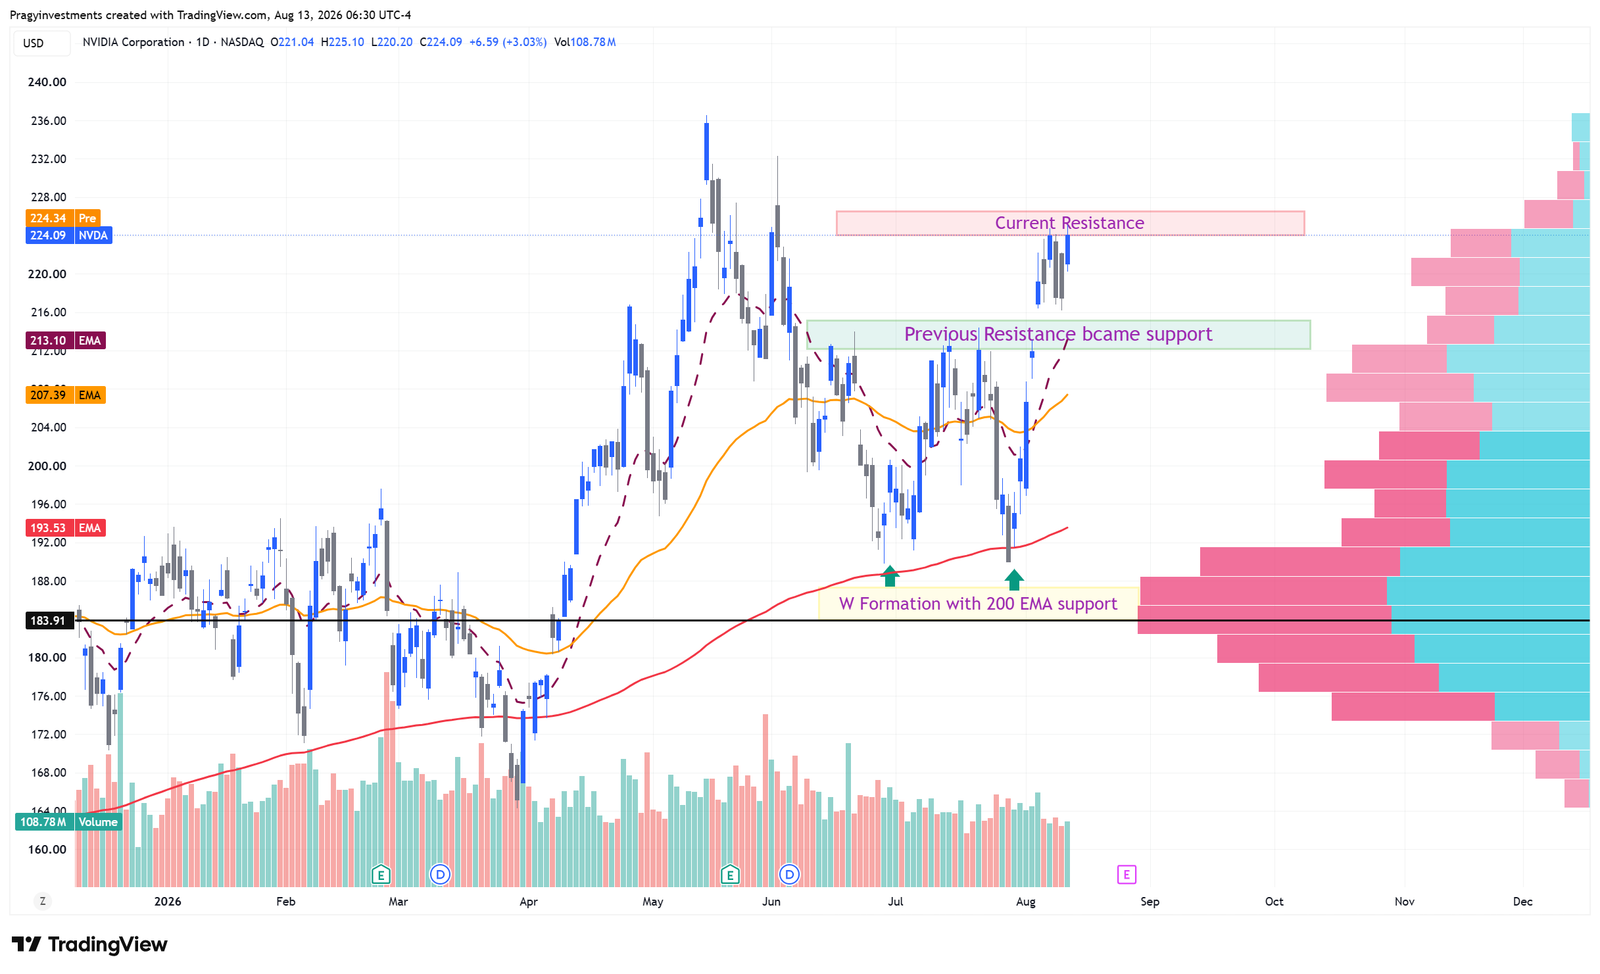
NVDA is a short-term breakout watch after a W-shaped recovery, a defense of longer-term trend support, and a reclaim of the $212–$215 area that previously acted as resistance. The daily chart is now testing the $223–$226 resistance area. A sustained move through that zone would keep the prior $235–$236 swing-high area relevant as an upside reference, while a loss of $212–$215 followed by weakness through $207–$210 would materially weaken the setup.
The fundamental backdrop remains strong: NVIDIA reported fiscal Q1 2027 revenue of $81.6 billion, up 85% year over year, with Data Center revenue of $75.2 billion, up 92%. The company guided fiscal Q2 revenue to $91.0 billion, plus or minus 2%, while assuming no Data Center compute revenue from China. The setup is classified as High risk because NVIDIA is scheduled to report fiscal Q2 2027 results on August 26, 2026, placing a major event inside this short-term research horizon.
Setup Metadata
| Field | Detail |
|---|---|
| Ticker | NVDA |
| Company / Fund | NVIDIA Corporation |
| Market | U.S. |
| Asset Type | Stock |
| Sector / Theme | Semiconductors / Accelerated Computing & AI Infrastructure |
| Setup Type | Breakout watch following a W-shaped reversal and prior-resistance-to-support reclaim |
| Trend View | Short-term bullish / constructive, testing resistance above the chart's EMA structure |
| Timeframe | Short term |
| Bias | Watching for new highs |
| Risk Level | High |
| Status | Watching |
Thesis Snapshot
“The market believes NVDA's rebound is still capped by the $223–$226 resistance area; I believe the W-shaped recovery, 200-day EMA defense, and reclaim of $212–$215 support keep the short-term structure constructive; the gap will close because sustained strength above resistance could shift attention back toward the prior $235–$236 high while recent official results continue to show strong Data Center growth; I am wrong if NVDA loses $212–$215 and then fails to hold the $207–$210 structure.”
Technical Setup
The daily chart shows a W-shaped recovery developing after two tests of the lower support structure, with the broader reversal occurring around the rising 200-day EMA. Price then reclaimed the $212–$215 region, which had previously acted as resistance. That area is now the first support zone that would need to hold for the short-term structure to remain constructive.
NVDA has advanced into the $223–$226 resistance area. This is the immediate confirmation zone for the setup: repeated rejection would keep the stock range-bound below resistance, while sustained strength through the area would improve the technical case for a retest of the prior $235–$236 swing-high region.
The chart also shows price trading above the shorter and intermediate EMA structure. That alignment supports the current trend view, but the setup is not considered confirmed solely because price has reached resistance. The $207–$210 area serves as the deeper invalidation zone for this specific breakout/reclaim thesis.
Fundamental Snapshot
NVIDIA's latest reported quarter supports the fundamental side of the watchlist thesis. For the first quarter of fiscal 2027, ended April 26, 2026, the company reported revenue of $81.6 billion, up 85% from a year earlier. Data Center revenue reached $75.2 billion, up 92% year over year. GAAP gross margin was 74.9%.
For fiscal Q2 2027, NVIDIA guided revenue to $91.0 billion, plus or minus 2%, and GAAP gross margin to 74.9%, plus or minus 50 basis points. Importantly, the company's outlook assumed no Data Center compute revenue from China, highlighting the continuing effect of export restrictions and market-access uncertainty.
Liquidity remains substantial. NVIDIA reported $50.3 billion of cash, cash equivalents, and marketable debt securities as of April 26, 2026, along with $30.2 billion of marketable equity securities. The company also said its board approved an additional $80.0 billion of share-repurchase authorization in May 2026.
The main fundamental strength is the scale and growth of NVIDIA's Data Center business alongside continued demand for accelerated computing and AI infrastructure. The main concern is that export controls, China market access, competitive responses, and policy changes can materially affect demand, product availability, and financial results.
Near-term event risk is elevated because NVIDIA is scheduled to discuss fiscal Q2 2027 results on August 26, 2026. That event falls directly inside the stated short-term timeframe and can produce price movement that overwhelms otherwise constructive technical structure.
Key Levels to Watch
| Level Type | Area / Level | Why It Matters |
|---|---|---|
| Support Area | $212–$215 | Prior resistance that has been reclaimed; buyers would need to defend this area to preserve the short-term structure. |
| Resistance Area | $223–$226 | Current supply area and immediate confirmation zone for the breakout-watch thesis. |
| Invalidation Area | $207–$210 | A sustained breakdown through this area would materially weaken the reclaim and breakout structure. |
| Upside Reference Area | $235–$236 | Prior swing-high region that becomes relevant if momentum improves above current resistance. |
What Would Prove This Wrong
Technical: The setup would weaken if NVDA loses the $212–$215 support area and then fails to hold the $207–$210 invalidation area. Continued rejection from $223–$226 without support holding would also argue against a near-term breakout continuation.
Fundamental: The thesis would weaken if upcoming results show a material slowdown in the Data Center growth profile, meaningful margin deterioration relative to management's outlook, or other evidence that demand is not supporting the current growth expectations.
Narrative: A worsening export-control or China market-access environment, or evidence that competitive alternatives are eroding NVIDIA's position faster than expected, would challenge the constructive fundamental narrative.
Education Notes
A prior resistance area can become support after a successful reclaim, but the transition is more useful when price subsequently defends that zone. A breakout watch also requires confirmation: reaching resistance is not the same as clearing it.
Upside reference areas are research markers rather than price objectives. They help frame where prior supply or market memory may become relevant if momentum strengthens.
Event risk matters even when the chart is constructive. Earnings can create gaps and volatility that override nearby technical levels, which is why this setup carries a High risk classification despite the positive trend structure.
Invalidation is more important than prediction. Defining what would weaken the thesis makes the research process testable rather than dependent on a single directional forecast.
Source Notes
- NVIDIA Investor Relations: “NVIDIA Announces Financial Results for First Quarter Fiscal 2027,” May 20, 2026 — https://investor.nvidia.com/news/press-release-details/2026/NVIDIA-Announces-Financial-Results-for-First-Quarter-Fiscal-2027/default.aspx
- U.S. Securities and Exchange Commission: NVIDIA Corporation Form 10-Q for the quarter ended April 26, 2026, filed May 20, 2026 — https://www.sec.gov/Archives/edgar/data/1045810/000104581026000052/nvda-20260426.htm
- U.S. Securities and Exchange Commission: NVIDIA Corporation Form 10-K for the fiscal year ended January 25, 2026, filed February 25, 2026 — https://www.sec.gov/Archives/edgar/data/1045810/000104581026000021/nvda-20260125.htm
- NVIDIA Investor Relations: “NVIDIA Sets Conference Call for Second-Quarter Financial Results,” July 29, 2026 — https://investor.nvidia.com/news/press-release-details/2026/NVIDIA-Sets-Conference-Call-for-Second-Quarter-Financial-Results/default.aspx
Author and Conflict Disclosure
Disclosure: The author and/or Pragy Investments may hold positions in the security or related instruments discussed. Any such exposure does not alter the educational and market-research purpose of this content.
Disclaimer
This content is for financial education and market research only. It is not investment advice, financial planning, portfolio management, tax advice, legal advice, or a recommendation to buy, sell, or hold any security. Trading and investing involve risk, including possible loss of capital. Readers are responsible for their own decisions and should consult a qualified financial professional before making financial decisions.