Technical analysis can look intimidating at first.
You open a chart and suddenly it feels like a cockpit. Candles everywhere. Lines everywhere. Indicators with names that sound like rejected robot characters.
Here’s the deal: technical analysis is not magical prediction. It is reading price behavior, spotting structure, managing risk, and making cleaner decisions.
For beginner traders, the goal is simple: stop staring at random movement and start asking better questions. What is the trend? Where are buyers showing up? Where are sellers defending? Is price clean, or is it noisy chop? Where would this idea be wrong?
That is the foundation.
Here’s the simple version
Technical analysis is the study of price, volume, and market structure.
Price shows what buyers and sellers are doing. Volume shows how much participation is behind a move. Market structure shows whether price is trending, ranging, breaking out, or getting messy.
The clean version: technical analysis helps you organize the chart so you can make decisions without emotional freestyle.
It does not remove risk. It does not guarantee outcomes. It does not mean every line matters.
A good beginner setup is built around trend, support and resistance, candlesticks, volume, risk management, and execution discipline.
Notice what is not on the list: 14 indicators stacked like a trading lasagna.
Start with trend first
Trend is the direction price is generally moving.
An uptrend means price is making higher highs and higher lows. A downtrend means price is making lower highs and lower lows. A range means price is moving sideways between areas.
This is where people mess up: they trade every tiny move without checking the bigger context.
A higher timeframe means zooming out to see the bigger trend before making a smaller entry decision. For beginners, a clean starting point is using the daily chart for the big picture and the 1-hour chart to refine the setup.
If the daily chart is trending upward, a beginner may study pullbacks. A pullback is a temporary move against the main trend. If the daily chart is sideways, the market may be in chop. Chop is messy sideways price action where neither buyers nor sellers clearly control the move.
Red flag: forcing trend trades inside chop. Green flag: waiting for structure to become obvious.
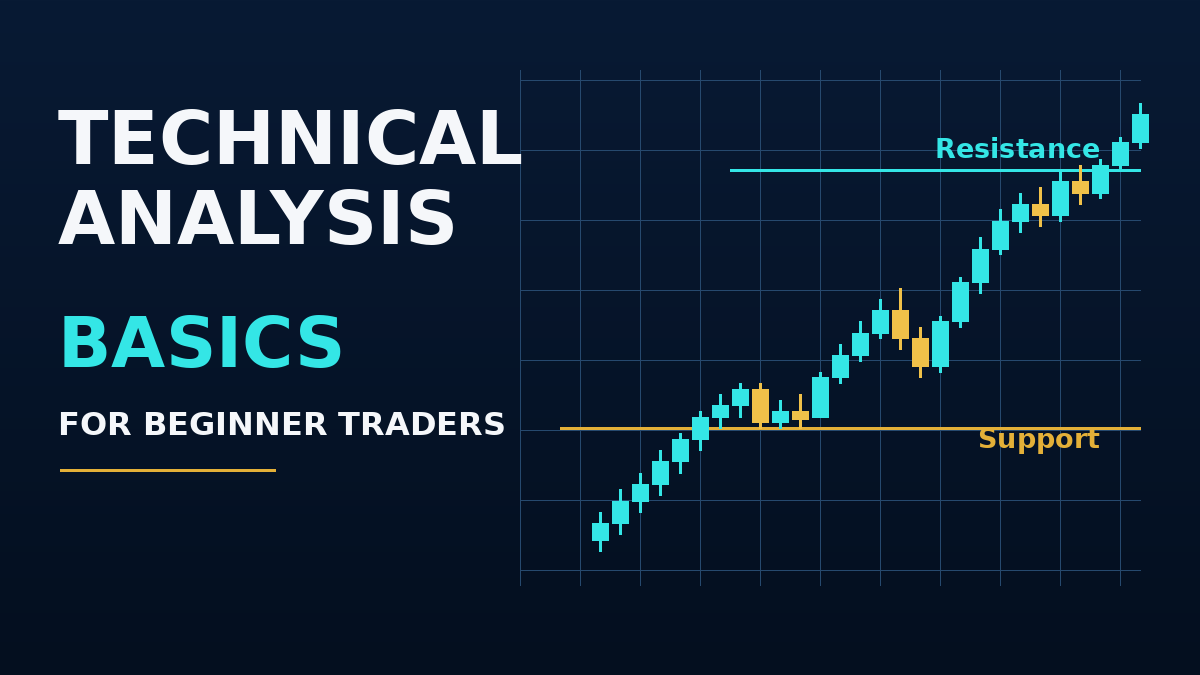
Support and resistance: the beginner’s map
Support is an area where buyers have previously stepped in.
Resistance is an area where sellers have previously stepped in.
Do not overcomplicate it. These are not magical lines. They are zones where price has reacted before.
The trap is drawing these levels with surgical precision. Markets are messy. Use zones, not laser beams.
A practical beginner approach: zoom out, mark obvious swing highs and swing lows, look for repeated reactions, and avoid drawing every tiny level.
If a chart has 27 lines on it, you are not analyzing anymore. You are decorating.
Candlesticks show behavior, not destiny
A candlestick shows how price moved during a period of time.
The candle body shows the open and close. The wick is the thin line above or below a candlestick showing how far price moved before closing.
A big bullish candle can show buying pressure. A big bearish candle can show selling pressure. Long wicks can show rejection, meaning price moved into an area but could not hold there.
But one candle by itself is not enough. A wick into support matters more than a random wick in the middle of nowhere.
Context is king. Single-candle obsession is how beginners end up treating charts like horoscopes.
Breakouts, fakeouts, and invalidation
A breakout happens when price moves above resistance or below support with enough strength to matter.
Sounds simple. The problem is fakeouts exist. Price can break a level, pull in late traders, then reverse back into the range.
A cleaner way to study breakouts is to ask: did price close beyond the level, or only wick through it? Did volume increase? Was the prior structure clean or messy? Is the move aligned with the higher timeframe?
Then ask the most important question: where is invalidation?
Invalidation is the price level or area where the trade idea is no longer valid. If someone is studying a breakout above resistance, invalidation might be price falling back below the breakout zone and failing to reclaim it.
That does not mean the trader was “wrong as a person.” It means the idea stopped working.
Volume, volatility, liquidity, and risk
Volume is the amount of shares, contracts, or units traded during a period. It helps show participation.
Liquidity means how easily something can be traded without a huge price jump. Thin liquidity can make entries and exits messier.
Volatility means how much price moves. High volatility can create larger movement, but it also creates larger risk. Low volatility can make price slow and compressed.
Technical analysis without risk management is chart confidence with no seatbelt.
A stop loss is a planned exit level used to limit damage if the trade goes wrong. Position sizing means deciding how much money to risk on one trade before entering.
A common beginner guardrail is risking about 1% to 2% of total account size on a single trade idea. For example, with a $5,000 account, 1% risk equals $50 of planned risk.
Risk/reward compares the amount you are risking to the potential reward. If the planned risk is $50 and the planned potential reward is $100, that is a 1:2 risk/reward idea.
This does not mean the trade will work. It means the plan is measurable.
A practical beginner framework
Use this five-step scan before studying any setup.
First, check the higher timeframe. Start with the daily chart. Is price trending up, trending down, or ranging? If you cannot tell, that is information.
Second, mark only obvious levels. Draw the clearest support and resistance zones. Ignore tiny levels that only make sense after squinting.
Third, watch price behavior near the level. Does price reject support, stall at resistance, break and hold, or immediately fail?
Fourth, define invalidation before any entry. If you cannot answer where the idea is wrong, the setup is not ready.
Fifth, size the risk. Use position sizing before entering, not after emotions show up. The math should come before the click.
Common mistakes beginner traders make
Indicator overload is the first mistake. A moving average is a line that smooths price over a chosen period to show general direction. It can help, but it should not replace structure.
Other common mistakes: drawing too many levels, ignoring the higher timeframe, chasing after price already moved far from a clean level, moving the stop loss because “it might come back,” and confusing analysis with execution.
Analysis is deciding what matters. Execution is following the plan when money and emotions show up.
Action checklist
Before studying a technical setup, ask:
- What is the higher timeframe trend?
- Where are the obvious support and resistance zones?
- Is price trending, ranging, or in chop?
- Is volume supporting the move?
- Is volatility normal, compressed, or expanded?
- Where is invalidation?
- What is the planned stop loss?
- What is the position size?
- Is the risk/reward reasonable?
- Am I following a plan or chasing a candle?
This checklist will not make trading easy. It will make it less random.
Final takeaway
Technical analysis is not about being right all the time.
It is about building a structured way to read price, define risk, and avoid emotional chaos.
The beginner edge is not a secret indicator. It is learning to see trend, levels, candles, volume, volatility, liquidity, and risk as one connected story.
Keep the chart clean. Keep the plan measurable. Keep the risk controlled.
Don’t overcomplicate it.
Disclaimer
Educational content only. Not personalized financial advice. Not a recommendation to buy, sell, or hold any security. Trading and investing involve risk, and loss of capital is possible.