
Most beginners look at a stock price and assume that is the price.
Clean. Simple. Convenient.
Also wrong.
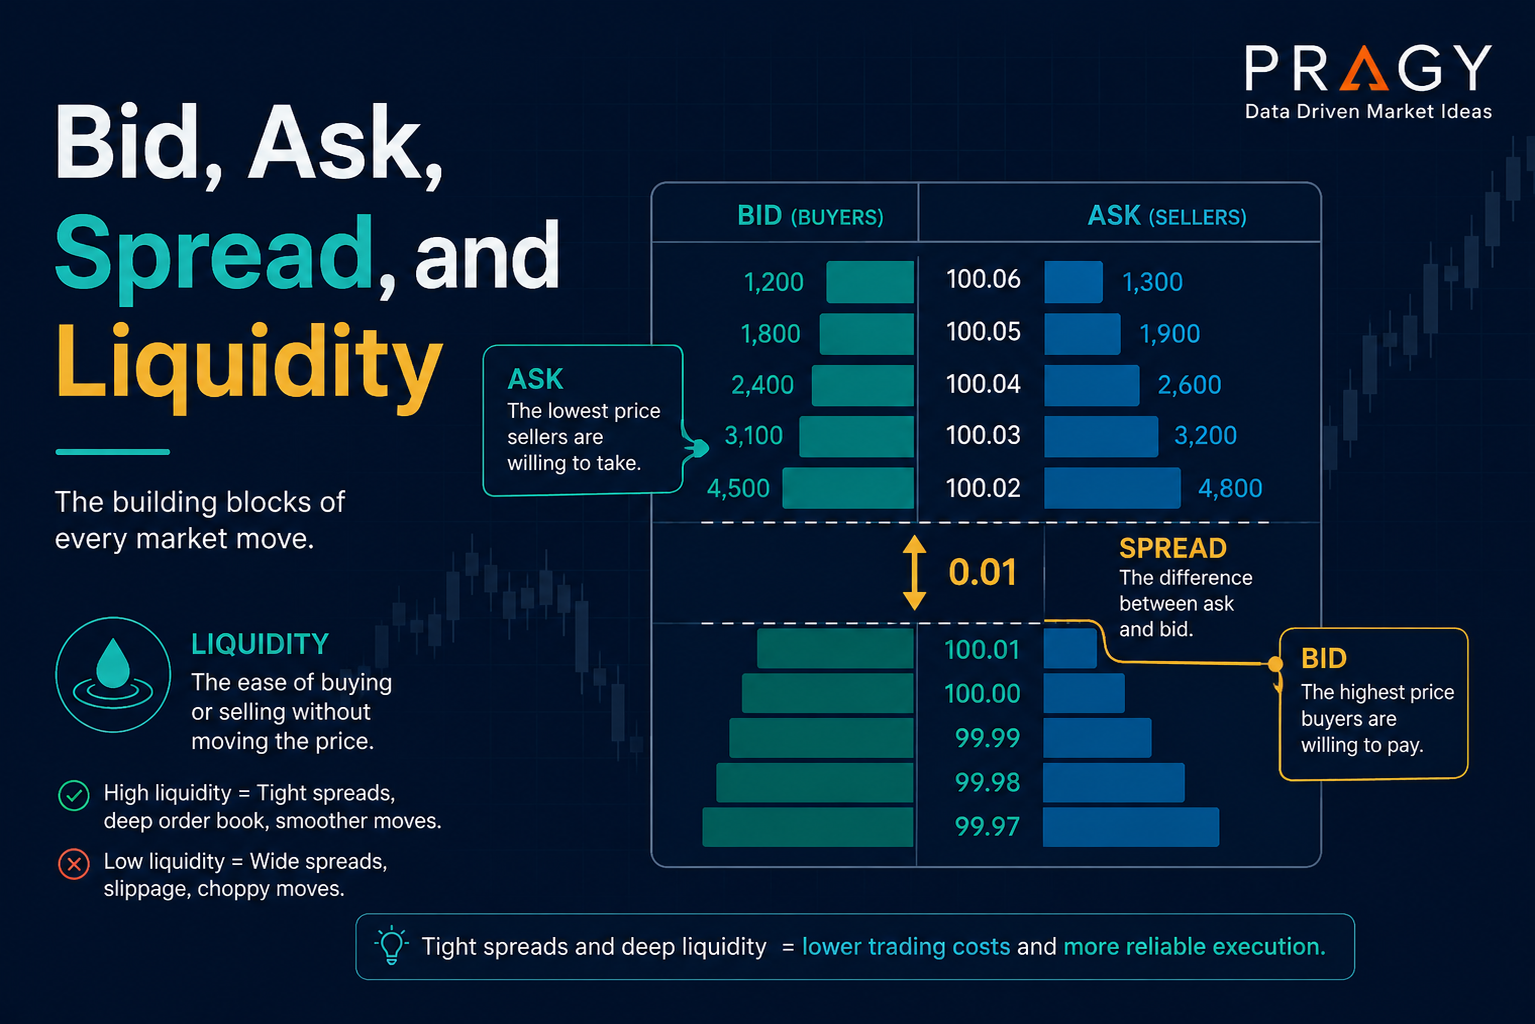
In real markets, there usually is not one magical price floating in space. There is a bid, an ask, and a spread between them. Then there is liquidity, which determines how easy it is to enter or exit without pushing the price around.
Here’s the deal: chart reading gets a lot more useful once you understand how trades actually happen. A good setup on a chart can still become a messy execution if the spread is wide, liquidity is thin, or the order type is sloppy.
This article explains the mechanics without turning your brain into an exchange manual.
Here’s the simple version
The bid is the highest price buyers are currently willing to pay.
The ask is the lowest price sellers are currently willing to accept.
The spread is the gap between the bid and ask.
Liquidity is how easily something can trade without causing a large price move.
That is the clean version.
Think of it like a marketplace.
A buyer says, “I’ll pay $25.10.”
A seller says, “I’ll accept $25.14.”
That four-cent gap is the spread. A trade happens when someone agrees to cross that gap.
Bid: what buyers are offering
The bid is the price buyers are currently offering. In a stock quote, it is usually shown next to the ask.
Example:
| Quote item | Price |
|---|---|
| Bid | $25.10 |
| Ask | $25.14 |
In this example, the best visible buyer is willing to pay $25.10.
That does not mean every buyer is at $25.10. There may be other buyers below that price at $25.09, $25.08, $25.00, and so on. But the bid shown in a simple quote is usually the best bid, meaning the highest current buyer offer.
This matters because if you use a market order to exit a long position, you may be filled near the bid, not at the last price you saw on the chart.
A market order is an order designed to execute immediately at the best available price. Fast? Yes. Precise? Not always.
Ask: what sellers are accepting
The ask is the price sellers are currently asking for. It is also called the offer.
Using the same quote:
| Quote item | Price |
|---|---|
| Bid | $25.10 |
| Ask | $25.14 |
The best visible seller is willing to accept $25.14.
If someone wants immediate execution, they may have to trade at the ask. That is the price of urgency.
This is where people mess up: they see the chart showing a recent trade at one price, then assume they can get filled at that exact price. But the current ask may already be higher, especially in fast-moving or thinly traded markets.
A limit order is an order that sets the maximum price you are willing to pay or the minimum price you are willing to accept. It gives you more price control, but execution is not guaranteed.
Spread: the cost hiding in plain sight
The spread is the difference between the ask and the bid.
Formula:
Spread = Ask - Bid
Example:
Ask: $25.14
Bid: $25.10
Spread: $0.04
A four-cent spread may look tiny. Sometimes it is. Sometimes it is not.
The trap is judging spreads only by the dollar amount. A $0.04 spread on a $25 stock is different from a $0.04 spread on a $2 stock.
You can also think about spread as a percentage:
Spread % = Spread / Midpoint Price
The midpoint price is the price halfway between the bid and ask.
Example:
Bid: $25.10
Ask: $25.14
Midpoint: $25.12
Spread: $0.04
Spread %: about 0.16%
Now compare that with a lower-priced example:
Bid: $2.00
Ask: $2.04
Midpoint: $2.02
Spread: $0.04
Spread %: about 1.98%
Same four cents. Very different execution cost.
That does not automatically make one “good” and the other “bad.” It just means the second example has a wider spread relative to price, so the trader needs to be more careful.
Liquidity: how easy it is to get in and out
Liquidity means the market has enough buyers and sellers to absorb trades smoothly.
A highly liquid stock usually has:
- many active buyers and sellers
- tighter bid-ask spreads
- smoother execution
- less price impact from normal-sized orders
A less liquid stock may have:
- fewer active participants
- wider spreads
- jumpier price movement
- more slippage
Slippage means getting filled at a worse price than expected. It can happen when prices move quickly or when there is not enough liquidity at the price you wanted.
Here’s a simple way to think about it.
Liquidity is not just whether something trades. It is whether it trades cleanly.
A stock can have a chart, a quote, and daily volume, but still have messy execution if the order book is thin.
Volume helps, but it is not the whole story
Volume is the number of shares or contracts traded during a period of time.
High volume often supports better liquidity, but volume and liquidity are not identical.
A stock might show decent daily volume but still have a wide spread during certain parts of the day. Another stock might be liquid during normal market hours but thin in pre-market or after-hours trading.
Red flag: assuming yesterday’s volume guarantees clean execution today.
Liquidity changes. News, time of day, volatility, market conditions, and participant interest all matter.
Volatility means how much and how quickly price moves. Higher volatility can make spreads widen because market participants demand more compensation for taking the other side of fast price movement.
Market depth: what is behind the quote
The bid and ask are just the front door.
Behind them is market depth, which shows how many shares or contracts may be available at different price levels. In simple terms, depth helps answer:
“How much size is actually available near the current price?”
Imagine this simplified order book:
| Level | Bid size | Bid price | Ask price | Ask size |
|---|---|---|---|---|
| Best | 500 | $25.10 | $25.14 | 400 |
| Next | 700 | $25.09 | $25.15 | 600 |
| Next | 1,200 | $25.08 | $25.16 | 900 |
The best bid and ask show the closest buyer and seller. The levels behind them show additional liquidity.
For beginners, the key lesson is not to stare at order book data all day. Don’t overcomplicate it. The useful lesson is this:
A tight spread with enough size near the market is usually easier to execute than a wide spread with tiny size.
Practical example: two stocks, same setup, different execution
Let’s say two stocks both show a similar chart pattern.
The chart looks clean. The trend looks stable. The setup appears interesting from an educational perspective.
Now look at the quotes:
| Item | Stock A | Stock B |
|---|---|---|
| Bid | $50.00 | $50.00 |
| Ask | $50.02 | $50.40 |
| Spread | $0.02 | $0.40 |
| Spread % | about 0.04% | about 0.80% |
Stock A has a tight spread. Stock B has a much wider spread.
If a beginner only looks at the chart, both might look similar. But execution conditions are not similar.
A wider spread means the trade idea starts with more friction. Price has to move more just to overcome the cost of crossing the spread. That does not mean Stock B is automatically unusable. It means the trader needs more patience, better order control, and a clearer plan.
The BASL framework
Use this simple checklist before getting too excited about a chart.
B — Bid
Where is the best bid?
Is there meaningful size behind it, or does it look thin?
A — Ask
Where is the best ask?
Is the ask close to the bid, or is there a large gap?
S — Spread
How wide is the spread in dollars and as a percentage of price?
Is the spread normal for this asset, or unusually wide?
L — Liquidity
Does the asset trade cleanly?
Is volume active today?
Is the market session normal, or are you looking during a thinner period like pre-market or after-hours?
The framework is not magic. It simply forces you to check execution quality before obsessing over chart patterns.
Common mistakes beginners make
Mistake 1: treating the last price as the fill price
The last traded price is historical. It tells you where a trade happened. It does not guarantee where your order will fill next.
Mistake 2: ignoring the spread
A wide spread can quietly damage a trade idea before the chart even has a chance to work.
Mistake 3: using market orders in thin conditions
Market orders prioritize speed. In thin liquidity, speed can get expensive.
Mistake 4: assuming volume equals liquidity
Volume is useful, but liquidity also depends on spread, depth, time of day, volatility, and current market interest.
Mistake 5: forgetting that liquidity can disappear
Liquidity can look fine one minute and dry up during news, sharp moves, halts, or emotional market conditions.
Action checklist
Before studying a possible setup, check the quote:
- What is the current bid?
- What is the current ask?
- How wide is the spread?
- What is the spread as a rough percentage of price?
- Is the spread normal or unusually wide?
- Is there enough visible liquidity near the current price?
- Is volume active today?
- Are you looking during regular market hours or a thinner session?
- Would a limit order provide better price control?
- Does the potential trade idea still make sense after execution friction?
Green flag: tight spread, active volume, reasonable depth, and calm execution conditions.
Red flag: wide spread, tiny size, jumpy price action, and a need to get filled immediately.
Final takeaway
Bid, ask, spread, and liquidity are not advanced trivia. They are basic market plumbing.
The bid tells you where buyers are offering.
The ask tells you where sellers are accepting.
The spread shows the gap between them.
Liquidity tells you whether the market can handle orders smoothly.
Beginners often focus only on direction: “Will price go up or down?”
Better market learners also ask: “Can this be executed cleanly?”
That question can save a lot of confusion.
Disclaimer
Educational content only. Not personalized investment, trading, tax, or legal advice. Trading and investing involve risk, and loss of capital is possible.