
A stock index is one of those market terms that sounds more complicated than it really is.
You hear it all the time:
“The market is up.” “The market is down.” “The S&P 500 hit a new high.” “The Nasdaq is getting crushed.”
Here’s the deal: when people say “the market,” they usually mean a stock index.
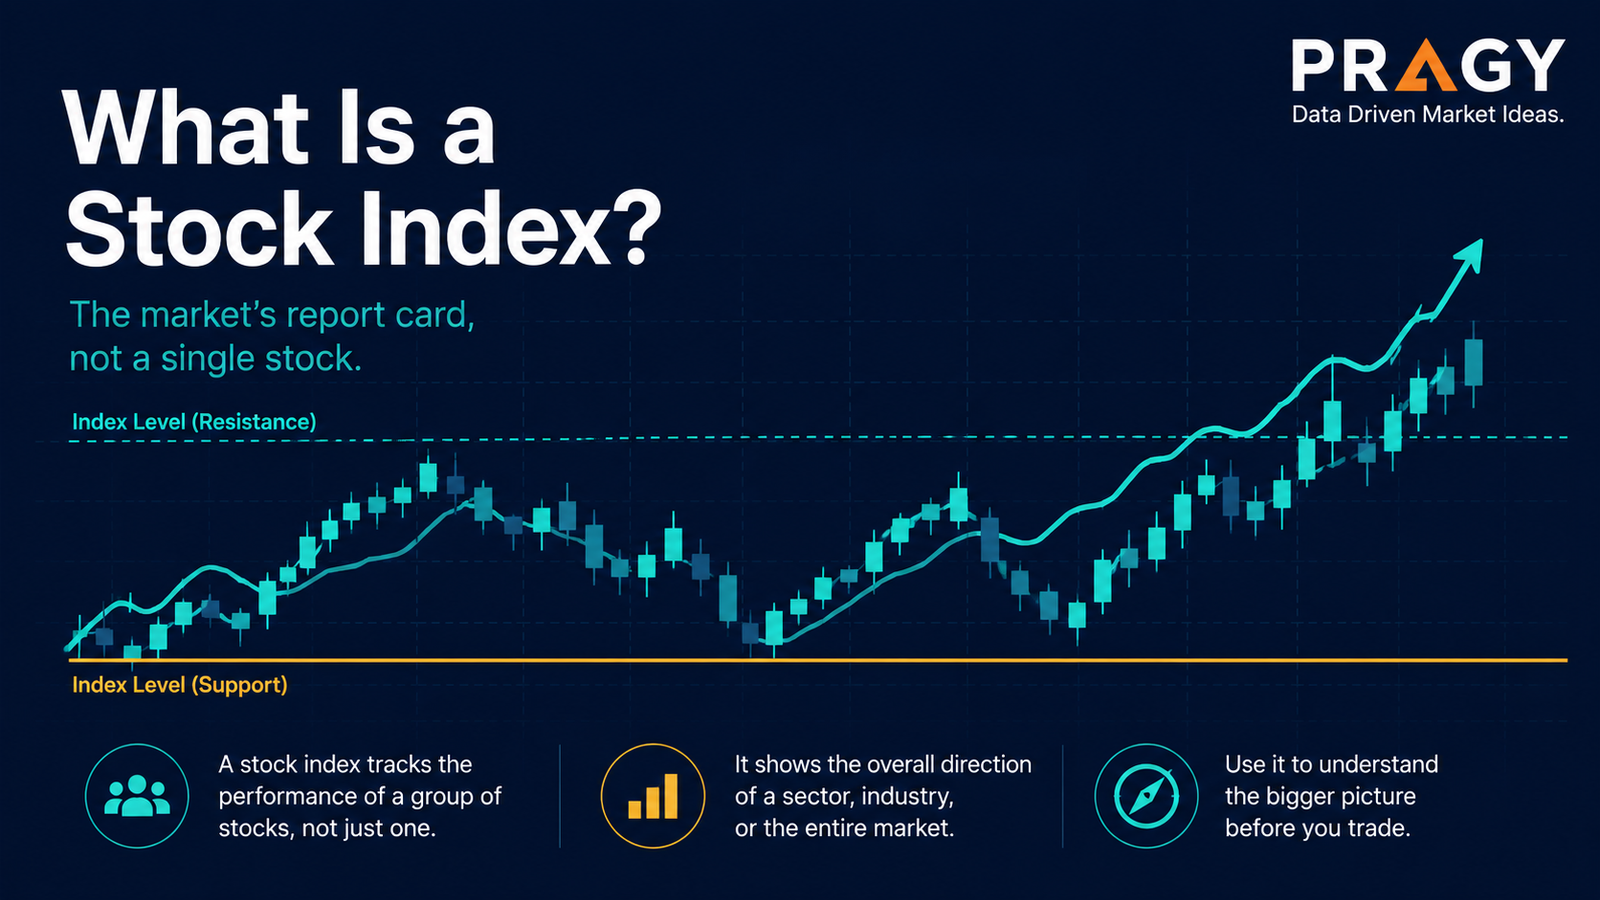
A stock index is not the entire market. It is a selected group of stocks used to measure a certain slice of the market. Think of it like a scoreboard. It tells you how a specific group is performing without forcing you to check every single stock one by one.
Useful? Very.
Perfect? Not even close.
Let’s clean it up.
Here’s the simple version
A stock index is a basket of stocks designed to track the performance of a market, sector, country, or investing style.
For example, an index might track:
- large U.S. companies
- technology-focused companies
- Canadian stocks
- small companies
- dividend-paying companies
- a specific sector like energy, banks, or healthcare
The clean version: an index gives you a quick read on a group of stocks.
It does not tell you what every stock is doing. It does not tell you whether a specific company is healthy. It does not tell you what you should do next.
It gives context.
And context matters.
Why stock indexes exist
Imagine trying to answer a simple question:
“How did the stock market do today?”
Without an index, that question gets messy fast. Which stocks? Which country? Which sector? Large companies or small companies? Banks or software names?
A stock index solves that problem by creating a standard measurement.
It lets people compare performance, track trends, and talk about the market using a shared reference point.
That is why indexes are used by:
- investors
- traders
- analysts
- financial media
- fund managers
- researchers
- everyday market learners
An index is basically a market language shortcut.
Instead of saying, “A selected group of large U.S. companies performed a certain way today,” people say, “The S&P 500 moved.”
Much easier. Slightly dangerous if you oversimplify it.
What is inside a stock index?
The stocks inside an index are called constituents. A constituent is simply a company included in the index.
An index provider creates rules for which companies qualify. Those rules may consider things like company size, trading volume, sector, country, exchange listing, or financial requirements.
This is where people mess up: they assume an index is random.
It is not.
Most indexes follow a methodology, which is a fancy word for “the rulebook.” The methodology explains how companies get added, removed, and weighted.
That matters because two indexes can both represent “the market” while behaving very differently.
How an index is calculated
Indexes are not all calculated the same way.
The most common approaches are:
Market-cap weighting
Market capitalization, often called market cap, means the total market value of a company’s shares. In plain English, it is the stock market’s current price tag for the company.
A market-cap-weighted index gives bigger companies more influence.
So if a giant company moves sharply, it can pull the index around more than a smaller company.
This is important because a market-cap-weighted index can rise even if many smaller stocks inside it are weak. A few large names can do a lot of heavy lifting.
Green flag: you understand that “the index is up” does not automatically mean “most stocks are up.”
Price weighting
A price-weighted index gives more influence to companies with higher stock prices.
This can be unintuitive because a company with a higher share price is not automatically “bigger” or more important than a company with a lower share price.
Share price alone does not tell you company size. Market cap does.
Equal weighting
An equal-weighted index gives every stock the same influence, at least at the reset point.
If there are 100 companies, each company starts with roughly a 1% weight.
This can give a cleaner view of the average stock inside the group, but it also behaves differently from a market-cap-weighted version.
Don’t overcomplicate it: weighting controls whose voice is loudest in the index.
Common examples of stock indexes
You will often hear about indexes like:
S&P 500
The S&P 500 is commonly used as a benchmark for large U.S. companies.
A benchmark is a standard used for comparison. If someone says a fund “beat the benchmark,” they mean it performed better than the index they are comparing it against.
Nasdaq Composite
The Nasdaq Composite tracks many stocks listed on the Nasdaq exchange and is often associated with growth and technology-heavy market action.
That does not mean every company in it is a technology company. It means the index often has major exposure to tech-related names.
Dow Jones Industrial Average
The Dow is one of the oldest and most quoted U.S. indexes.
It is price-weighted, which makes it different from many popular market-cap-weighted indexes.
TSX Composite
For Canadian market learners, the TSX Composite is a major index used to follow broad Canadian equity market performance.
It often has meaningful exposure to sectors like financials, energy, and materials.
The trap: never assume every index behaves the same way. The rules, sectors, and weighting can change the story.
Can you buy a stock index?
Technically, no.
You cannot directly buy an index because an index is just a measurement. It is not a stock. It is not a company. It is not a fund.
But investors can access products designed to track an index, such as:
- exchange-traded funds, called ETFs
- mutual funds
- index-linked products
An ETF, or exchange-traded fund, is a fund that trades on an exchange like a stock. Some ETFs are designed to track indexes.
Important: an index and an index-tracking fund are not the same thing.
The index is the scoreboard.
The fund is the product trying to follow the scoreboard.
That difference matters because funds can have fees, tracking differences, liquidity conditions, tax considerations, and trading spreads.
Why stock indexes matter
Stock indexes are useful because they help answer practical market questions.
They show the bigger picture
A single stock can move for company-specific reasons.
An index helps you see broader market direction.
For example, if one stock is falling while the broad index is strong, that weakness may be company-specific. If the stock is falling while the whole index is weak, the move may be part of a broader market pullback.
A pullback is a temporary move against the main direction. In index terms, it usually means the index has declined from a recent high without necessarily changing the bigger trend.
They help compare performance
Indexes are often used as benchmarks.
If a strategy, fund, or watchlist gains 5%, that sounds good. But if the relevant index gained 12% over the same period, the context changes.
Performance without a benchmark is just a number floating in space.
They show market leadership
Market leadership means which areas are driving the move.
Sometimes the broad index looks strong because a handful of large companies are carrying it. Other times strength is broad, with many sectors participating.
Both situations can look similar on the surface. Under the hood, they are different.
They help organize research
Indexes can help self-directed learners narrow their research.
Instead of scanning every stock everywhere, you can study a specific index, sector, or theme. That keeps the process cleaner.
Pragy Investments focuses on financial education and market research for self-directed market learners focused on U.S. and Canadian stocks. Indexes are one way to organize that learning.
A simple mini-index example
Let’s build a tiny example.
Imagine an index with only three companies:
| Company | Market Value | Index Influence |
|---|---|---|
| Company A | $800 billion | High |
| Company B | $150 billion | Medium |
| Company C | $50 billion | Low |
If this mini-index is market-cap weighted, Company A has the biggest influence.
Now imagine:
- Company A rises 3%
- Company B falls 2%
- Company C falls 4%
The index might still finish higher because Company A is much larger.
That does not mean most stocks were strong. It means the largest stock had enough influence to push the index up.
This is one of the most important beginner lessons.
An index can hide weakness.
An index can also hide strength.
You need to know what is driving the move.
Index level vs. index percentage move
Indexes are usually quoted in points and percentages.
A point move tells you the raw change in index value.
A percentage move tells you the move relative to the index level.
For beginners, percentage moves are usually more useful because they make comparisons cleaner.
For example, a 100-point move can mean different things depending on whether the index is at 2,000 or 20,000.
The percentage move gives better scale.
Indexes are not perfect market truth
A stock index is useful, but it is not magic.
Red flag: treating one index as “the whole market.”
A large-cap U.S. index may not represent small companies. A tech-heavy index may not represent banks or utilities. A Canadian index may behave very differently from a U.S. index because sector exposure is different.
Indexes simplify the market.
That is their strength.
It is also their weakness.
Common mistakes beginners make
Mistake 1: Thinking “the market” means every stock
When an index is up, some stocks inside it may still be down.
When an index is down, some stocks may still be strong.
The index gives the summary, not the full story.
Mistake 2: Ignoring weighting
If you do not understand weighting, you can misread the move.
A market-cap-weighted index may be driven by a small group of large companies. An equal-weighted version may tell a different story.
The question is not just, “Is the index up?”
The better question is, “What is driving the index?”
Mistake 3: Confusing an index with a fund
An index is a measurement.
A fund is a product.
They are connected, but they are not identical.
Mistake 4: Using the wrong benchmark
Comparing a Canadian bank stock to a U.S. technology-heavy index may not tell you much.
Use a benchmark that actually matches what you are studying.
Mistake 5: Overreacting to one headline
Market headlines compress a lot of detail into a tiny sentence.
“The market fell today” might mean one major index declined. It may not mean every sector, every country, or every stock was weak.
Headlines are starting points, not conclusions.
A practical framework for reading an index
Use this simple three-step check.
1. What does the index represent?
Ask:
- What country or region?
- What company size?
- What sectors?
- What type of stocks?
- How many constituents?
Know the basket before you judge the score.
2. How is it weighted?
Ask:
- Is it market-cap weighted?
- Price-weighted?
- Equal-weighted?
- Sector-weighted?
Weighting tells you which stocks have the biggest voice.
3. What is happening underneath?
Ask:
- Are many stocks participating?
- Is one sector doing most of the work?
- Are large companies carrying the move?
- Is the index hiding weakness or strength?
The index is the front door. The details are inside the house.
Action checklist
Before using an index in your market research, check:
- What the index is designed to track
- Which sectors have the most influence
- Whether it is market-cap weighted, price-weighted, or equal-weighted
- Whether the move is broad or concentrated
- Whether you are comparing it to the right benchmark
- Whether you are looking at the index itself or a product tracking it
- Whether your conclusion is educational research context, not a trading command
The goal is not to memorize every index.
The goal is to understand what an index is telling you — and what it might be leaving out.
Final takeaway
A stock index is a market scoreboard.
It helps you understand how a group of stocks is performing, compare results, track trends, and organize research.
But the scoreboard does not tell the whole game.
The smarter approach is simple: know what the index tracks, understand how it is weighted, and look under the surface before drawing conclusions.
That is how you move from headline-reading to actual market learning.
Disclaimer
Educational content only. Not personalized investment advice. Not a recommendation to buy, sell, or hold any security. Trading and investing involve risk, including possible loss of capital.