
A breakout looks simple.
Price pushes above a key level. The chart looks strong. Beginners jump in. Then price snaps back below the level like it changed its mind just to be rude.
That is a failed breakout.
And yes, it is one of the most common ways traders get trapped.
Here’s the deal: failed breakouts are not “random.” They usually happen around obvious levels, crowded expectations, weak confirmation, and poor risk planning. The goal is not to predict every fakeout. The goal is to stop treating every breakout like it deserves your money.
Here’s the simple version
A breakout happens when price moves above resistance or below support with enough strength to matter.
Resistance is an area where sellers have previously stepped in. Support is an area where buyers have previously stepped in.
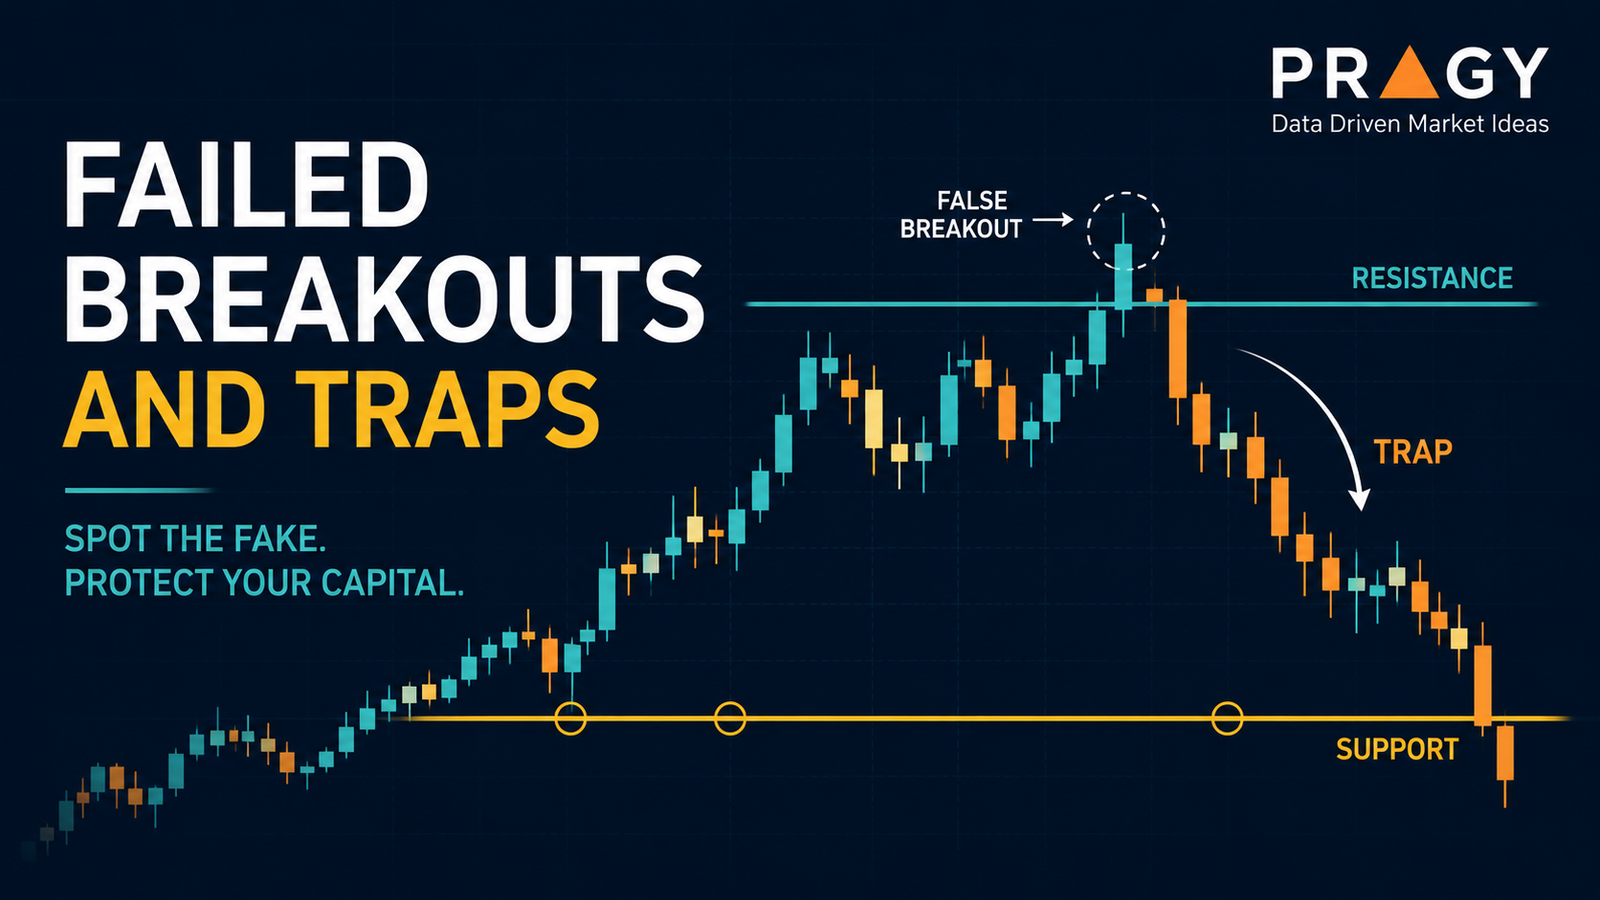
A failed breakout happens when price breaks beyond one of those levels, attracts traders into the move, and then reverses back inside the prior range.
The trap is psychological:
- The level is obvious.
- The move looks urgent.
- Late traders enter.
- Price reverses.
- Those late traders are forced to exit.
That forced exit can fuel the reversal.
The clean version: a breakout is only useful if the market can hold the level after breaking it.
Why failed breakouts happen
Markets do not move in clean textbook lines. They move through pressure, liquidity, emotion, and execution.
Liquidity means available orders in the market. Price often moves toward areas where many orders may be sitting, such as above recent highs or below recent lows.
When a chart shows a clear resistance level, many traders see the same thing. Some place entries above the level. Others place stop losses there. A stop loss is a planned exit level used to limit damage if the trade goes wrong.
That creates a crowded area.
Price may push above resistance, trigger those orders, and then reverse if there is not enough real demand to continue. The breakout technically happened, but the follow-through failed.
This is where people mess up: they confuse a level being touched with a level being accepted.
The anatomy of a breakout trap
A typical failed upside breakout has five parts.
1. A clean resistance level
The chart forms a level where price has struggled before. The cleaner the level, the more traders may be watching it.
That is useful.
It is also dangerous.
Obvious levels can attract obvious behavior.
2. A fast push through the level
Price moves above resistance. The candle may look strong in the moment. Traders feel pressure to act quickly.
A candlestick is a chart bar that shows the open, high, low, and close for a time period. The close matters because it shows where price finished, not just where it briefly traveled.
3. A weak close or long wick
A wick is the thin line above or below a candlestick showing how far price moved before closing.
If price breaks above resistance but closes back under it, that is a warning sign. A long upper wick can show that buyers pushed price up, but sellers rejected the move before the candle closed.
Red flag: price breaks the level but cannot close beyond it.
Green flag: price breaks the level, closes beyond it, and later holds the area during a retest.
4. No real follow-through
A valid breakout usually needs follow-through. That does not mean price must explode immediately. It means the market should continue accepting the new area.
If price breaks out and then stalls, drifts, or instantly reverses, the breakout is under observation. It has not earned full trust yet.
Volume can help here. Volume means how many shares or contracts traded during a period. A breakout with higher volume may show stronger participation. A breakout with weak volume may show low conviction.
Volume is not magic. It is context.
5. A move back inside the range
This is the trap door.
Once price falls back below the breakout level, traders who entered late may start exiting. That selling pressure can accelerate the move down.
The failed breakout becomes the setup.
Breakout, fakeout, or normal retest?
Not every pullback after a breakout is a trap.
A pullback is a temporary move against the main trend. Sometimes price breaks resistance, pulls back to test that old resistance as new support, and then continues higher.
So how do you tell the difference?
You do not need a crystal ball. You need a checklist.
A healthier breakout often shows:
- A clear close beyond the level
- Better-than-normal volume
- Price holding the broken level on a retest
- A clean invalidation level
- Alignment with the higher timeframe
A weaker breakout often shows:
- A brief pierce above the level with no close
- A long wick rejecting the move
- Weak volume
- Immediate move back into the prior range
- A breakout directly into a larger resistance area
Invalidation is the price level or area where the trade idea is no longer valid.
Don’t overcomplicate it. If the breakout cannot hold the level it just broke, the setup deserves caution.
Use the higher timeframe before trusting the breakout
A higher timeframe means zooming out to see the bigger trend before making a smaller entry decision. For beginners, a clean starting point is using the daily chart for the big picture and the 1-hour chart to refine the setup.
Why does this matter?
Because a breakout on a small chart may be running straight into resistance on a larger chart.
Example: a 15-minute chart may show price breaking above a local range. But the daily chart may show price hitting a major resistance zone from three months ago.
That is not automatically bad.
But it changes the context.
The trap: trading a small breakout without checking the bigger ceiling above it.
A practical failed-breakout framework
Use this simple framework when studying a breakout.
Step 1: Mark the level
Identify the support or resistance area first. Avoid drawing lines everywhere. Use the levels that price clearly respected multiple times.
Step 2: Wait for the close
A candle that pokes above resistance is not the same as a candle that closes above resistance.
The close helps filter noise.
Step 3: Watch the retest
After a breakout, price may retest the old level. On an upside breakout, old resistance may become new support.
You are looking for acceptance, not perfection.
Does price hold the level? Does it bounce cleanly? Does volume support the move? Or does price fall back into the old range?
Step 4: Define invalidation before entry
Decide where the idea is wrong before taking action.
For example, if price breaks above resistance and then closes back below that level, the breakout thesis may be invalidated.
This is not about being right. It is about knowing when the idea stopped making sense.
Step 5: Size the risk
Position sizing means deciding how much money to risk on one trade before entering.
A common beginner guardrail is risking about 1% to 2% of total account size on a single trade idea. For example, with a $5,000 account, 1% risk equals $50 of planned risk.
That does not make a trade safe. It simply keeps one wrong idea from becoming a financial mess.
Example: the clean breakout versus the trap
Imagine a stock has resistance near $50.
Scenario A: cleaner breakout
Price closes at $51.20 with stronger volume. The next day, price pulls back near $50.20, holds above the old resistance area, and then moves higher again.
Possible interpretation: the market may be accepting the breakout area.
Not a guarantee. Just cleaner behavior.
Scenario B: failed breakout
Price spikes to $51.10 during the session but closes at $49.60. The candle leaves a long upper wick. The next candle trades lower, and price stays back inside the prior range.
Possible interpretation: the breakout attempt failed, and late breakout traders may be trapped.
Again, not a prediction. It is a risk framework.
Common mistakes beginners make
Mistake 1: Entering because the candle is moving fast
Speed feels like confirmation. Often, it is just emotion.
Fast moves into obvious levels can create poor entries if you have no plan for invalidation.
Mistake 2: Ignoring the candle close
A breakout that cannot close beyond the level is weaker than it looks in real time.
The market can visit a price without accepting it.
Mistake 3: Trading breakouts in chop
Chop is messy sideways price action where neither buyers nor sellers clearly control the move.
Breakouts inside choppy markets fail often because there is no clean trend behind them. In chop, price can break a level, reverse, break another level, and reverse again.
The chart is not broken. It is just not clean.
Mistake 4: Forgetting volatility
Volatility means how much price moves over a period of time.
Higher volatility can create larger wicks, wider swings, and more false breaks. That does not mean avoid every volatile chart. It means your stop, position size, and expectations need to match the environment.
Mistake 5: Having no exit plan
The market does not owe your breakout a continuation move.
If the level fails, the plan should already exist.
Action checklist
Before trusting a breakout, ask:
- Did price close beyond the level?
- Is the breakout aligned with the higher timeframe?
- Is volume supporting the move?
- Did price hold the level on a retest?
- Where is invalidation?
- What is the planned risk?
- Is the chart trending, or is it stuck in chop?
- Is the breakout running directly into another major level?
If the answers are messy, the setup may still be educational. It just may not be clean enough for action.
Final takeaway
Failed breakouts are not just annoying chart behavior. They are lessons in crowd psychology.
A breakout gets attention. A failed breakout reveals whether the market actually accepted the move.
The trap is chasing the first push.
The skill is waiting for confirmation, respecting invalidation, checking the higher timeframe, and sizing risk before emotion takes over.
Clean trading is not about catching every breakout.
It is about avoiding the ones that were built to trap you.
Disclaimer
Educational content only. Not personalized financial advice. Not a recommendation to buy, sell, or hold any security. Trading and investing involve risk, and loss of capital is possible.