
Moving averages are one of the first technical analysis tools beginners discover.
Then they immediately do what beginners do best: add seven of them, change the colors twelve times, and wonder why the chart looks like spaghetti.
Here’s the deal: moving averages are useful, but only when you know what job each one is supposed to do.
The 20, 50, and 200 simple moving averages, often called SMAs, are popular because they help traders and investors quickly read short-term momentum, medium-term structure, and long-term trend.
They are not magic lines. They do not predict the future. They are tools for context.
Here’s the simple version
A simple moving average, or SMA, is the average closing price over a set number of periods.
A 20 SMA on a daily chart shows the average closing price over the last 20 trading days. A 50 SMA shows the last 50. A 200 SMA shows the last 200.
The clean version:
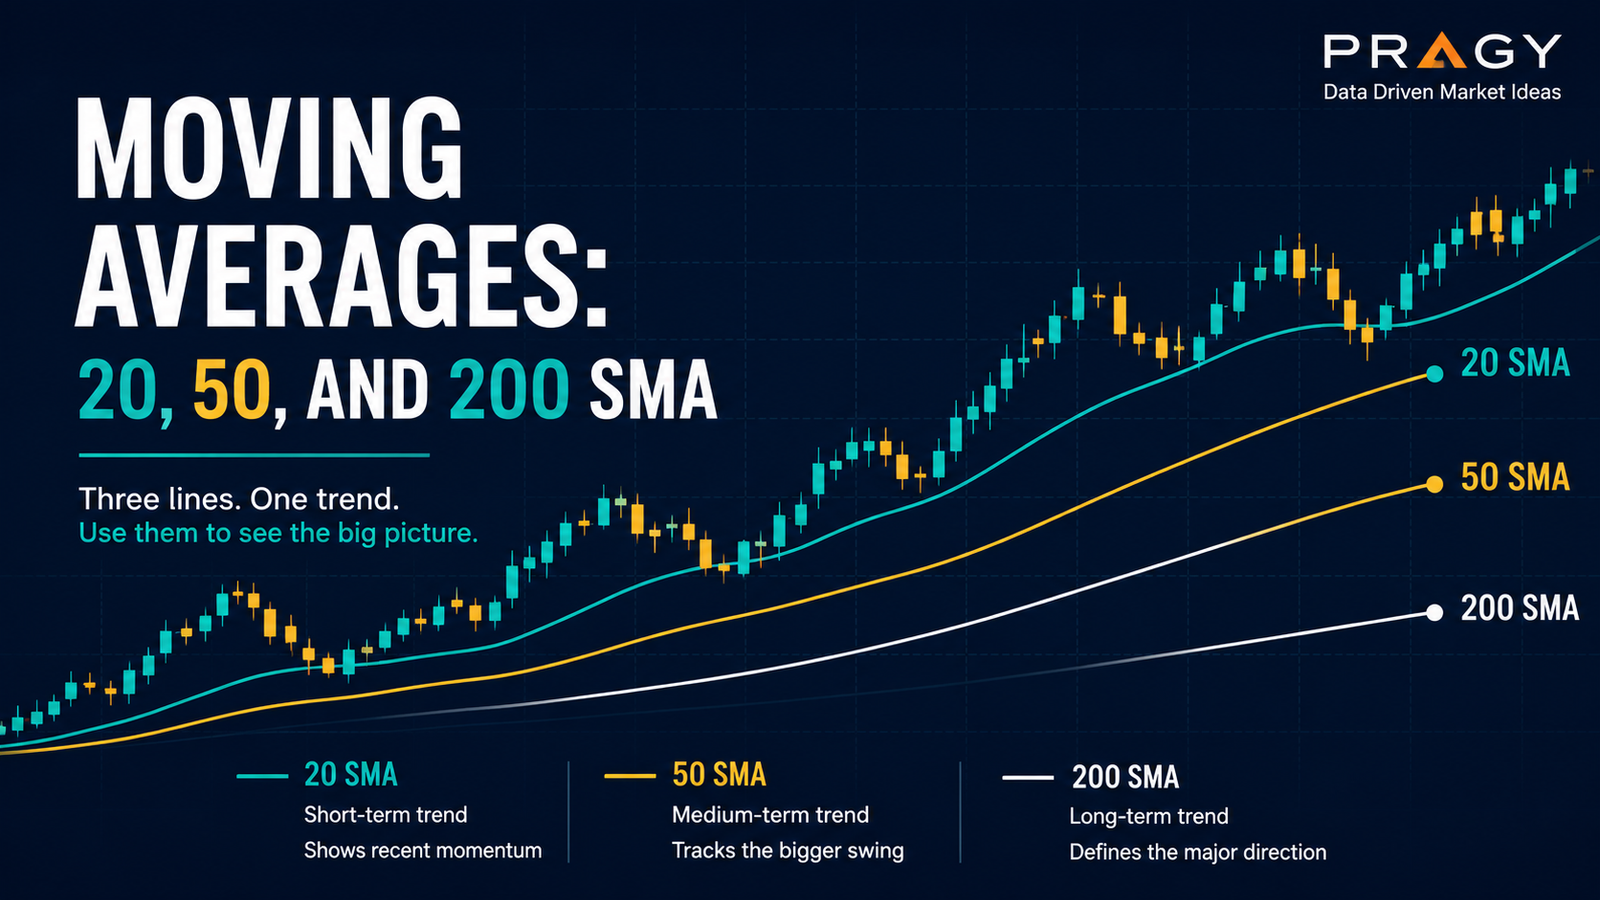
- 20 SMA: Short-term momentum and pullback rhythm.
- 50 SMA: Medium-term trend structure.
- 200 SMA: Long-term trend filter.
Don’t overcomplicate it. The shorter the moving average, the faster it reacts. The longer the moving average, the slower it reacts.
What the 20 SMA actually tells you
The 20 SMA is the fast one.
It stays closer to price and reacts quickly when momentum changes. In a strong trend, price may repeatedly pull back toward the 20 SMA before continuing.
A pullback is a temporary move against the main trend. For example, if price has been rising and then dips for a few candles, that dip is a pullback.
The 20 SMA can help answer:
“Is price still moving with short-term strength, or is momentum cooling off?”
Green flag: price is holding near a rising 20 SMA during a clean trend.
Red flag: price keeps slicing above and below the 20 SMA with no clear direction. That is often chop, which means messy sideways price action where neither buyers nor sellers clearly control the move.
The trap: treating every touch of the 20 SMA as an entry signal.
A moving average is context. It is not a button.
What the 50 SMA actually tells you
The 50 SMA is the structure line.
It smooths out more noise than the 20 SMA and gives a cleaner view of the medium-term trend. Many traders use it to judge whether a pullback is normal or whether the trend may be weakening.
A rising 50 SMA often suggests medium-term trend strength. A falling 50 SMA often suggests weakness. A flat 50 SMA usually says the market is undecided.
This is where people mess up: they look at price touching the 50 SMA and assume it must hold.
Nope.
The 50 SMA can act like dynamic support or dynamic resistance, but it is not guaranteed. Support is an area where buyers have previously stepped in. Resistance is an area where sellers have previously stepped in. Dynamic simply means the level moves over time instead of staying horizontal.
Use the 50 SMA with price structure, not instead of it.
What the 200 SMA actually tells you
The 200 SMA is the big-picture filter.
It moves slowly, which is exactly the point. It helps you zoom out and ask:
“Is this market generally above or below its long-term trend?”
When price is above a rising 200 SMA, the long-term trend context is often stronger. When price is below a falling 200 SMA, the long-term context is often weaker.
But again, not magic.
Price can trade above the 200 SMA and still fail. Price can trade below it and still rally. The 200 SMA is a map, not a fortune teller.
A beginner-friendly way to use it:
- Above a rising 200 SMA: focus on whether bullish setups have cleaner structure.
- Below a falling 200 SMA: be more cautious with bullish setups and understand the larger trend may be working against them.
- Around a flat 200 SMA: expect more noise and false starts.
How to read the 20, 50, and 200 SMA together
The real value shows up when you read the three moving averages as a group.
When the 20 SMA is above the 50 SMA, and the 50 SMA is above the 200 SMA, the chart often has bullish trend alignment. That means short-term price action, medium-term structure, and long-term trend are generally pointing in the same direction.
When the 20 SMA is below the 50 SMA, and the 50 SMA is below the 200 SMA, the chart often has bearish trend alignment.
When all three are tangled together, the market may be in chop. That is a warning to slow down.
The clean version:
Bullish alignment
Price is above the 20 SMA.
The 20 SMA is above the 50 SMA.
The 50 SMA is above the 200 SMA.
The slopes are rising.
That suggests trend strength.
Bearish alignment
Price is below the 20 SMA.
The 20 SMA is below the 50 SMA.
The 50 SMA is below the 200 SMA.
The slopes are falling.
That suggests trend weakness.
Messy alignment
Price is crossing back and forth.
The moving averages are flat or tangled.
Breakouts fail quickly.
Pullbacks do not behave cleanly.
That suggests chop.
Use moving averages with a higher timeframe
A higher timeframe means zooming out to see the bigger trend before making a smaller entry decision. For beginners, a clean starting point is using the daily chart for the big picture and the 1-hour chart to refine the setup.
Example:
You might use the daily chart to see whether price is above or below the 200 SMA. Then you might use the 1-hour chart to study a cleaner pullback, support area, or breakout attempt.
A breakout happens when price moves above resistance or below support with enough strength to matter. A weak breakout that quickly falls back into the range is often a warning sign.
A practical SMA framework
Here is a simple framework for using the 20, 50, and 200 SMA without turning your chart into a science project.
Step 1: Start with the 200 SMA
Ask:
“Is price above, below, or around the 200 SMA?”
This gives you the long-term context.
You are not making a decision yet. You are building the map.
Step 2: Check the 50 SMA
Ask:
“Is the 50 SMA rising, falling, or flat?”
This tells you whether the medium-term structure supports the big-picture trend.
A rising 50 SMA above a rising 200 SMA is cleaner than a flat 50 SMA tangled with price.
Step 3: Use the 20 SMA for rhythm
Ask:
“Is price respecting the 20 SMA during pullbacks, or is it constantly breaking through it?”
In a strong trend, the 20 SMA may help you see momentum rhythm. In a weak or messy market, it may produce noise.
Step 4: Add price levels
Moving averages should not replace support and resistance.
Look for:
- Prior swing highs
- Prior swing lows
- Clean support zones
- Clean resistance zones
- Volume changes
Volume means the amount of trading activity during a period. Rising volume near a breakout may suggest stronger participation. Low volume can make a move less convincing.
Step 5: Define invalidation before execution
Invalidation is the price level or area where the trade idea is no longer valid.
Execution means the actual process of entering, managing, and exiting a trade idea based on a plan.
Before acting on any setup, a trader should know:
- Where the idea is wrong
- How much capital is at risk
- What would confirm strength
- What would signal weakness
Educational example: reading the setup
Imagine a stock is trading above a rising 200 SMA.
The 50 SMA is also rising and price has respected it several times. The 20 SMA is above the 50 SMA, but price pulls back toward the 50 SMA after a strong move.
Now you are not saying, “This must bounce.”
You are saying:
“The trend context is still constructive, but I need price to prove strength.”
A possible educational framework:
- Long-term context: price above rising 200 SMA
- Medium-term structure: 50 SMA rising
- Short-term rhythm: pullback toward the 20 or 50 SMA
- Confirmation area: price reclaims a prior resistance zone
- Invalidation area: price loses the pullback low or key support zone
- Risk plan: position size based on planned risk, not excitement
A stop loss is a planned exit level used to limit damage if the trade goes wrong.
Position sizing means deciding how much money to risk on one trade before entering. A common beginner guardrail is risking about 1% to 2% of total account size on a single trade idea. For example, with a $5,000 account, 1% risk equals $50 of planned risk.
That does not mean risking the whole account. It means defining the dollar amount that could be lost if the idea fails.
Moving average crossovers: useful, but not enough
A moving average crossover happens when one moving average crosses above or below another.
For example, the 20 SMA crossing above the 50 SMA may suggest short-term momentum is improving. The 50 SMA crossing above the 200 SMA may suggest medium-term structure is improving relative to the long-term trend.
But crossovers can be late.
They are based on past price. By the time a crossover appears, a large part of the move may already have happened.
The trap is using crossovers alone.
Better question:
“Does the crossover happen with clean price structure, supportive volume, and a clear risk level?”
If not, it may just be noise wearing a nice outfit.
Common mistakes with the 20, 50, and 200 SMA
Mistake 1: Using moving averages as predictions
Moving averages do not predict. They summarize.
They help you understand trend context based on recent price behavior.
Mistake 2: Ignoring slope
A rising moving average and a flat moving average are not the same.
Slope matters. Flat moving averages often mean the market is undecided.
Mistake 3: Treating every touch like support
A moving average may act as support in one trend and fail in another.
Always combine it with structure.
Mistake 4: Using them the same way on every timeframe
A 20 SMA on a 5-minute chart behaves very differently from a 20 SMA on a daily chart.
Shorter timeframes create more noise. Higher timeframes usually provide cleaner context.
Mistake 5: Adding too many moving averages
More lines do not equal more clarity.
The 20, 50, and 200 SMA are already enough for most beginners to understand trend layers.
Action checklist
Before using the 20, 50, and 200 SMA in a chart review, ask:
- Is price above, below, or around the 200 SMA?
- Is the 200 SMA rising, falling, or flat?
- Is the 50 SMA confirming the trend or warning of weakness?
- Is price respecting the 20 SMA, or is it chopping through it?
- Are the moving averages stacked cleanly or tangled together?
- Is there nearby support or resistance?
- Is volume supporting the move?
- Where is invalidation?
- What is the planned risk before execution?
The goal is not to find a perfect setup.
The goal is to avoid sloppy decisions.
Final takeaway
The 20, 50, and 200 SMA are simple tools for reading market context.
The 20 SMA helps with short-term rhythm.
The 50 SMA helps with medium-term structure.
The 200 SMA helps with long-term trend.
Used together, they can make a chart easier to read. Used poorly, they become colorful clutter.
The best approach is boring in a good way: use moving averages to understand trend, combine them with support and resistance, define invalidation, manage risk, and avoid treating any one line like a crystal ball.
Don’t overcomplicate it.
Disclaimer
Educational content only. Not personalized financial advice, not a recommendation to buy, sell, or hold any security. Trading and investing involve risk, including possible loss of capital.