
Most beginners discover pullbacks right after they get tired of chasing breakouts.
That is usually how the lesson arrives.
Price runs. Everyone gets excited. You jump in late. Then price cools off, pulls back, and suddenly your “great entry” feels like standing in the wrong checkout line.
Here’s the deal: a pullback setup is not magic. It is simply a way to study whether a trend is taking a healthy pause before continuing.
Used well, it gives traders a cleaner framework. Used badly, it becomes an excuse to catch falling knives with inspirational confidence.
Let’s clean it up.
Here’s the simple version
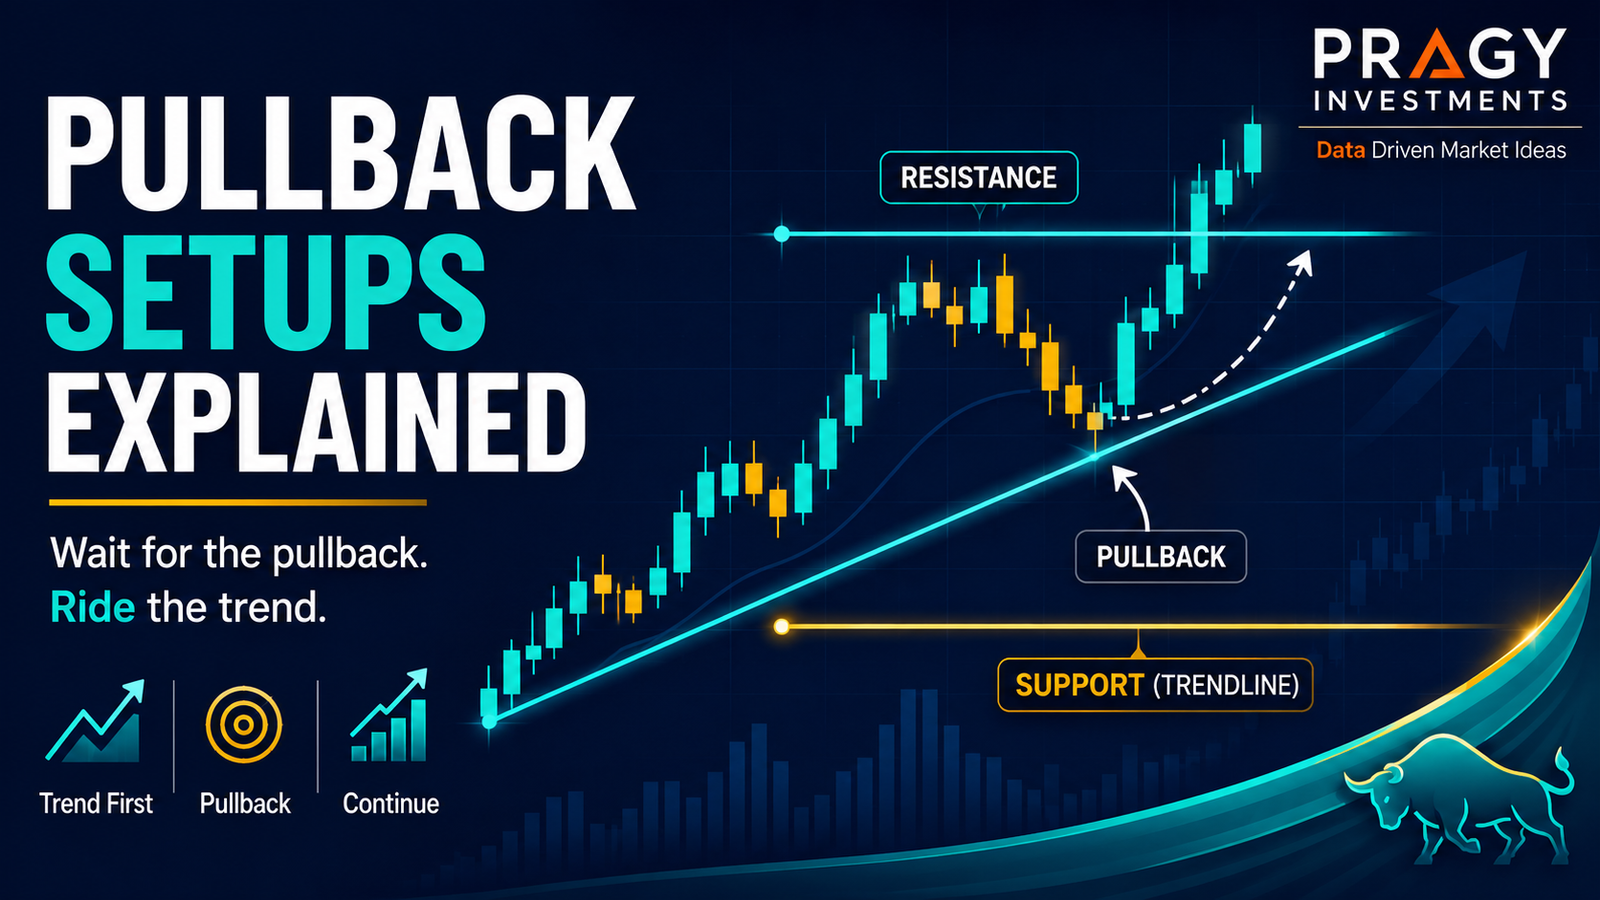
A pullback is a temporary move against the main trend.
In an uptrend, price moves higher, then dips back toward a key area. In a downtrend, price moves lower, then bounces back toward a key area.
The goal is not to predict the future. The goal is to ask a practical question:
Is price pulling back into an area where the trend may continue, or is the trend starting to fail?
That is the whole game.
A pullback setup usually has five pieces:
- A clear trend
- A key area
- A controlled retracement
- A confirmation clue
- A defined invalidation level
Do not overcomplicate it.
What makes a pullback setup different from a random dip?
A random dip is just price moving lower.
A pullback setup has context.
Context means the chart already showed a directional move before the pullback happened. Without that trend, you are not really studying a pullback. You may just be staring at chop.
Chop is messy sideways price action where neither buyers nor sellers clearly control the move.
The trap is thinking every small drop is an opportunity. It is not. Sometimes price is pulling back. Sometimes price is breaking down. Sometimes price is just being annoying.
A cleaner pullback has structure:
- Price is trending.
- The pullback moves into a logical area.
- The move against the trend looks controlled, not chaotic.
- The trader can define where the idea is wrong.
That last part matters more than people want to admit.
Start with the higher timeframe
A higher timeframe means zooming out to see the bigger trend before making a smaller entry decision. For beginners, a clean starting point is using the daily chart for the big picture and the 1-hour chart to refine the setup.
This is where people mess up.
They look at a 5-minute chart, see a tiny dip, and call it a pullback. Meanwhile, the daily chart is a mess, the stock is below major resistance, and volume is doing nothing helpful.
The higher timeframe helps answer:
- Is the broader trend up, down, or sideways?
- Is price near a major support or resistance area?
- Is this pullback happening after a real move or inside random noise?
Support is an area where buyers have previously stepped in.
Resistance is an area where sellers have previously stepped in.
A pullback into support during an uptrend may be worth studying. A pullback into resistance during a downtrend may also be worth studying. But a “pullback” in the middle of nowhere is usually just a candle with good marketing.
The anatomy of a cleaner pullback
A good pullback setup is not just “price went down, therefore interesting.”
The clean version has a sequence.
1. Trend first
Before studying the pullback, identify the trend.
An uptrend usually shows higher highs and higher lows. A higher high means price pushes above a previous swing high. A higher low means the next dip holds above the prior dip.
In plain English: buyers keep stepping in sooner, and price keeps pushing higher.
A downtrend is the opposite: lower highs and lower lows.
Green flag: price has a clear directional rhythm.
Red flag: price is whipping around with no structure.
2. Pullback into a key area
A key area can be previous support, a rising trendline, a moving average, or a former resistance area that may now act as support.
A moving average is a line that smooths price over a selected number of periods, such as 20 or 50 candles. Traders often use it to study trend direction and dynamic support or resistance.
The best pullbacks are usually simple to explain:
“Price broke above resistance, started trending, and pulled back toward the prior breakout area.”
That is much cleaner than:
“I drew seven lines, added four indicators, and found a hidden level only visible after espresso.”
3. Watch the character of the pullback
Not all pullbacks are equal.
A controlled pullback often has smaller candles, lighter volume, and fewer sharp breakdown candles. That can suggest the move against the trend is cooling rather than collapsing.
Volume shows how much trading activity happened during a candle or period. Rising volume can signal stronger participation. Low volume can signal less urgency.
A scary pullback often has wide candles, heavy selling pressure, and broken support areas.
Volatility means how much price moves. High volatility can create opportunity, but it can also make risk harder to control.
The key question is not, “Did price pull back?”
The better question is, “Did price pull back in a way that still respects the trend?”
4. Look for confirmation, not perfection
Confirmation is a clue that the pullback may be stabilizing.
Examples include:
- Price holds a prior support area.
- A candle closes back above a key level.
- Price breaks a small pullback trendline.
- Volume improves as price turns back with the trend.
- A bullish candle forms near support in an uptrend.
A candlestick shows price movement for a selected period, including the open, high, low, and close. A wick is the thin line above or below a candlestick showing how far price moved before closing.
A long lower wick near support can show that sellers pushed price down, but buyers stepped in before the candle closed. That does not guarantee anything. It is just useful context.
Breakout pullbacks: the classic version
A breakout happens when price moves above resistance or below support with enough strength to matter.
A breakout pullback happens when price breaks through a level, then returns to test that same area.
In an uptrend, this might look like:
- Price pushes above resistance.
- The old resistance becomes a possible support area.
- Price pulls back toward that area.
- Traders watch whether buyers defend it.
- If the level fails, the idea may be invalidated.
Invalidation is the price level or area where the trade idea is no longer valid.
This is the part beginners often skip.
They love the setup. They love the chart. They love the story. But they do not define where the story is wrong.
That is how a small educational example turns into a large emotional problem.
Trendline pullbacks: useful, but not sacred
A trendline is a diagonal line used to connect swing lows in an uptrend or swing highs in a downtrend.
Trendline pullbacks can be helpful because they show rhythm. Price moves with the trend, pulls back toward the trendline, then either respects it or breaks through.
But trendlines are not concrete walls. They are visual guides.
Two traders can draw slightly different trendlines and both can make reasonable arguments. That is why trendlines should not be the entire setup.
Use them with context:
- What is the higher timeframe trend?
- Is price also near support or resistance?
- Is volume confirming or fading?
- Where is invalidation?
The trendline is a tool. It is not a personality.
Pullback setups need risk before entry
A setup is incomplete until risk is defined.
A stop loss is a planned exit level used to limit damage if the trade goes wrong. A stop loss is not a guarantee of exact execution, especially in fast-moving markets, but it helps create a risk framework.
Position sizing means deciding how much money to risk on one trade before entering.
A common beginner guardrail is risking about 1% to 2% of total account size on a single trade idea. For example, with a $5,000 account, 1% risk equals $50 of planned risk.
That means the question is not, “How many shares can I afford?”
The better question is:
How much can I risk if this idea fails?
Then the trader works backward.
Example:
- Account size: $5,000
- Planned risk: 1% = $50
- Distance from entry area to invalidation: $1.00 per share
- Position size example: 50 shares
This is not a recommendation. It is an educational example showing how risk math can guide decision-making.
Risk/reward: know the tradeoff
Risk/reward compares the amount planned to risk against the possible reward area.
For example, if a trader risks $1 per share and studies a possible move of $2 per share, that is a 1:2 risk/reward scenario.
The trap is forcing the chart to fit the ratio.
A weak setup does not become strong because the spreadsheet looks nice. The chart still has to make sense.
A cleaner approach:
- Define invalidation first.
- Identify a logical target area, such as prior resistance.
- Check whether the possible reward justifies the risk.
- Skip setups where the math is too tight or the chart is too messy.
Skipping is a skill. Boring, yes. Useful, absolutely.
Practical framework: the 5-question pullback check
Before treating a pullback as a serious setup, run it through this checklist.
1. Is there a clear trend?
No trend, no pullback setup. Just noise.
2. Is price pulling back into a logical area?
Look for support, resistance, trendline, moving average, or prior breakout area.
3. Is the pullback controlled?
Smaller candles and less aggressive counter-trend movement are usually cleaner than panic candles and broken levels.
4. Where is the idea invalidated?
If you cannot define where the setup is wrong, the setup is not ready.
5. Does the risk/reward make sense?
The potential reward area should be logical, not imaginary.
This framework will not make every setup work. Nothing does. But it can help reduce random decision-making.
Common mistakes beginners make
Mistake 1: Chasing before the pullback happens
The market moves fast, and beginners feel like they are missing it.
So they enter after the move has already stretched. Then the normal pullback arrives, and it feels like a disaster.
The pullback setup exists partly to avoid that chase.
Mistake 2: Calling every dip a pullback
A dip inside a broken trend is not automatically a pullback.
Sometimes the trend has changed. Sometimes support failed. Sometimes the chart is telling you to stop arguing with it.
Mistake 3: Ignoring the higher timeframe
A small pullback can look beautiful on a lower timeframe and still be sitting directly under major resistance on the daily chart.
Zoom out first.
Mistake 4: Moving the invalidation level
A plan is useful only if you respect it.
If price reaches the level where the idea is no longer valid, changing the level after the fact is not analysis. It is negotiation.
Mistake 5: Oversizing because the setup “looks clean”
Clean setups still fail.
That is why position sizing matters. Risk control is not the boring part of trading education. It is the survival part.
Action checklist
Before studying a pullback setup, check:
- Trend is clear on the higher timeframe.
- Pullback is moving into a logical area.
- Support or resistance is easy to explain.
- The pullback is controlled, not chaotic.
- Confirmation exists, or you are waiting for it.
- Invalidation is defined before any entry decision.
- Position size is based on planned risk, not excitement.
- Risk/reward is logical.
- The setup is educational, not emotional.
Final takeaway
Pullback setups are popular because they feel patient.
Instead of chasing the move, traders wait for price to come back toward a level where the trend may continue.
But patience is not enough. The setup still needs trend context, a key area, confirmation, invalidation, and risk control.
The clean version is simple:
Trend first. Pullback second. Risk always.
Don’t overcomplicate it.
Disclaimer
Educational content only. Not financial advice or a recommendation to buy, sell, or hold any security. Trading and investing involve risk, and loss of capital is possible.