
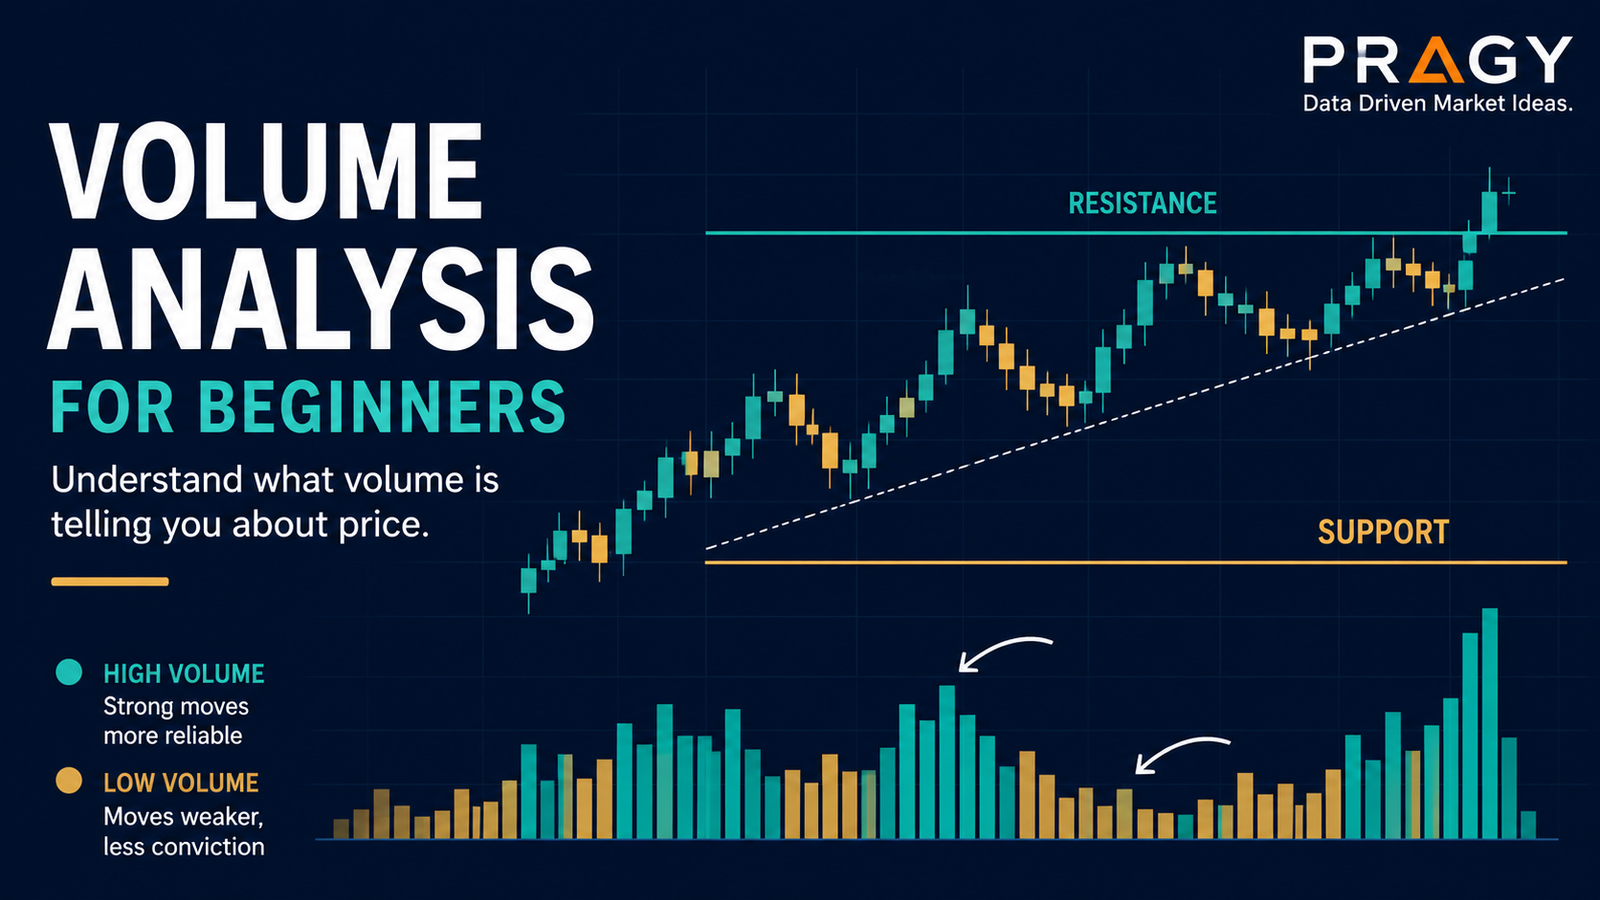
Price tells you what happened.
Volume helps you understand how much participation showed up while it happened.
That one idea can save beginners from a lot of messy chart reading. A candle by itself can look impressive. A breakout can look clean. A pullback can look harmless. But without volume, you may be looking at a move with weak participation, low conviction, or a trap waiting to embarrass your watchlist.
Here’s the deal: volume analysis is not magic. It does not predict the future. It does not turn every chart into a clean opportunity. But it can help you separate stronger market behavior from weak, noisy movement.
Used properly, volume becomes a confirmation tool. Not the driver. Not the boss. The confirmation.
Here’s the simple version
Volume means the number of shares traded during a specific period.
On a stock chart, volume usually appears as vertical bars below the price chart. A daily chart shows daily volume bars. A 1-hour chart shows the volume traded during each hour. Simple enough.
The clean version:
- Price moving up on higher volume can suggest stronger buyer participation.
- Price moving down on higher volume can suggest stronger seller participation.
- Price moving sideways on low volume may suggest indecision or lack of interest.
- Breakouts with weak volume deserve extra caution.
- Pullbacks on lighter volume can sometimes be healthier than pullbacks on heavy selling volume.
Notice the wording: can suggest. Not guarantee.
Volume is context. It is evidence. It is not a crystal ball wearing a finance hoodie.
Why volume matters
A price move becomes more meaningful when more market participants are involved.
Think about it like a vote.
If five people vote for a direction, that tells you something. If five thousand people vote for the same direction, that tells you more. Volume helps you see whether a price move attracted real participation or just drifted through a thin part of the chart.
This matters because beginners often focus only on candles.
A big green candle looks exciting. A big red candle looks scary. But volume helps answer better questions:
- Did the move happen with strong participation?
- Did the breakout attract buyers?
- Did sellers show up aggressively at resistance?
- Is the pullback calm, or is it heavy distribution?
- Is the chart trending, or is it stuck in chop?
Chop is messy sideways price action where neither buyers nor sellers clearly control the move. Volume can help you recognize chop because price may bounce around with inconsistent participation and no clean follow-through.
The three volume questions beginners should ask
Don’t overcomplicate it. Start with three questions.
1. Is current volume above or below average?
One volume bar by itself is not very helpful.
You need comparison.
A common beginner approach is to compare today’s volume against recent average volume, often using a 20-day or 50-day average volume line. If today’s volume is clearly above normal, participation has increased. If it is below normal, the move may have less confirmation.
This does not automatically make a move good or bad. It simply tells you whether the market is paying more attention than usual.
Green flag: price breaks above an important level while volume expands above average.
Red flag: price breaks above a level on weak volume, then quickly falls back below it.
2. Is volume confirming the price direction?
Price and volume should be read together.
If price is trending higher and volume expands on upward moves, that can suggest stronger demand. If price rises but volume keeps fading, that can suggest the move is losing energy.
Same idea on the downside. If price falls sharply on heavy volume, sellers may be active. If price pulls back on lighter volume after a strong move, the pullback may be less aggressive.
A pullback is a temporary move against the main trend. In an uptrend, a pullback is a short-term decline. In a downtrend, it is a short-term bounce.
The trap: assuming every low-volume pullback is bullish. Sometimes low volume simply means nobody cares yet. Context matters.
3. Where is volume happening?
Volume near important price levels matters more.
Support is an area where buyers have previously stepped in.
Resistance is an area where sellers have previously stepped in.
If price approaches resistance and volume suddenly increases while candles show rejection, sellers may be defending that area. If price pushes through resistance with expanding volume and holds above it, the breakout may have better confirmation.
A breakout happens when price moves above resistance or below support with enough strength to matter.
The words “enough strength” are doing work here. Beginners often treat any tiny move above resistance as a breakout. That is how false breakouts get invited into the group chat.
Volume and breakouts
Breakouts are where volume analysis becomes especially useful.
A clean breakout is not just price crossing a line. It is price crossing a meaningful level with participation, follow-through, and a reasonable risk plan.
A beginner-friendly breakout checklist:
Breakout quality improves when:
Price moves above a clear resistance area, volume expands above recent average, the candle closes strongly, and price does not immediately fall back into the prior range.
Breakout quality weakens when:
Price barely clears resistance, volume is below average, the candle has a large upper wick, or price quickly returns below the breakout level.
A wick is the thin line above or below a candlestick showing how far price moved before closing. A long upper wick near resistance can show that price pushed higher but sellers pulled it back down before the candle closed.
This is where people mess up: they see price move above a line for two minutes and call it a breakout. Then they are shocked when it fails.
Volume does not remove breakout risk. It helps you grade the setup.
Volume and pullbacks
Pullbacks are not automatically bad.
In fact, many cleaner setups happen after price pulls back, resets, and then continues in the original direction.
Volume can help you judge whether a pullback looks controlled or aggressive.
A controlled pullback may show:
- Price drifting lower after a strong upward move
- Volume lighter than the breakout volume
- Candles becoming smaller
- Price holding above a prior support area
A more concerning pullback may show:
- Large red candles
- Heavy selling volume
- Price slicing through support
- No sign of buyers stepping in
Again, not a guarantee. But the difference matters.
A pullback on lighter volume can suggest the move is cooling off rather than collapsing. A pullback on heavy volume can suggest the prior move is being challenged.
Volume spikes: useful, but dangerous when misunderstood
A volume spike is a sudden surge in volume compared with recent activity.
Volume spikes can happen around earnings, news, analyst actions, economic reports, index rebalancing, or major technical levels. They can also happen during panic selling or emotional buying.
A spike tells you attention has arrived.
It does not tell you the direction will continue.
The beginner mistake is treating every high-volume green candle as bullish and every high-volume red candle as bearish. Sometimes a huge volume spike can mark exhaustion, where the crowd rushes in late and the move stalls.
Better question: what happened after the volume spike?
Did price hold the level? Did the next candles confirm the move? Did the stock build structure, or immediately reverse? Did volume stay elevated, or vanish?
Volume spikes are clues. Follow-through is the confirmation.
Higher timeframe first, always
A higher timeframe means zooming out to see the bigger trend before making a smaller entry decision.
For beginners, a clean starting point is using the daily chart for the big picture and the 1-hour chart to refine the setup.
Why does this matter for volume?
Because volume on a small timeframe can look dramatic while the larger chart still looks messy. A 5-minute volume spike may feel important, but if the daily chart is stuck below major resistance, the setup may still be low quality.
Use the higher timeframe to answer:
- Is the stock in an uptrend, downtrend, or range?
- Is price near support or resistance?
- Is volume expanding at meaningful levels?
- Is the move part of a bigger pattern, or just intraday noise?
The higher timeframe keeps you from getting hypnotized by tiny candles.
A simple volume analysis framework
Here is a practical way to review a chart.
Step 1: Mark the obvious levels
Start with support and resistance. Keep it simple. You do not need twelve lines on the chart. Mark the areas where price clearly reacted before.
Step 2: Check the trend
Is price making higher highs and higher lows? That can suggest an uptrend. Is it making lower highs and lower lows? That can suggest a downtrend. Is it moving sideways? That may be a range.
Step 3: Compare current volume to average volume
Look for whether volume is expanding or drying up. A moving average on volume can help beginners avoid guessing.
Step 4: Match volume to price behavior
Ask whether volume supports the move. Strong move, strong volume? Weak move, weak volume? Heavy volume into resistance? Low volume breakout? These details matter.
Step 5: Define invalidation before acting
Invalidation is the price level or area where the trade idea is no longer valid.
For example, if a breakout thesis depends on price holding above a prior resistance area, falling back below that area may invalidate the idea.
This is risk management, not pessimism.
Step 6: Use position sizing
Position sizing means deciding how much money to risk on one trade before entering.
A common beginner guardrail is risking about 1% to 2% of total account size on a single trade idea. For example, with a $5,000 account, 1% risk equals $50 of planned risk.
That means the distance between your entry idea and invalidation point should help determine how many shares fit the risk plan.
Volume can help with setup quality. Position sizing helps with survival.
Practical example: reading a breakout with volume
Imagine a stock has been stuck below $50 for several weeks. Every time price approaches $50, sellers show up. That makes $50 a resistance area.
One day, price closes at $51.20.
Now the beginner question is not “Should I chase it?”
The better questions are:
- Was volume above average on the breakout day?
- Did price close near the high, or did it leave a large upper wick?
- Did price hold above the prior resistance area after the breakout?
- Is the higher timeframe trend supportive?
- Where would the idea be invalidated?
- Does the risk fit a reasonable position size?
If volume was well above average, price closed strongly, and the next pullback held near $50 on lighter volume, that may be a cleaner educational example of breakout confirmation.
If volume was weak, the candle had a huge upper wick, and price fell back under $50 the next day, that may be a possible false breakout.
No need to make it dramatic. Just read the evidence.
Common mistakes beginners make with volume
Mistake 1: Reading volume without price
Volume alone is incomplete. High volume can happen during buying, selling, reversals, news events, or exhaustion. Always connect volume to the candle and the location on the chart.
Mistake 2: Treating one candle like a full story
One strong candle does not define a trend. Look for follow-through.
Mistake 3: Ignoring average volume
A volume bar only matters compared with what is normal for that stock. Some stocks trade millions of shares daily. Others barely trade. Context matters.
Mistake 4: Chasing high-volume breakouts without a risk plan
A strong breakout can still fail. A stop loss is a planned exit level used to limit damage if the trade goes wrong. Using a stop does not guarantee the exact exit price, but it forces you to define risk before emotion takes over.
Mistake 5: Confusing liquidity with opportunity
Liquidity means how easily a stock can be bought or sold without heavily affecting price. More liquidity usually means smoother execution, but it does not automatically mean the setup is high quality.
Execution means the actual process of entering, managing, and exiting a trade. Good analysis can still turn into poor results if execution is sloppy.
Mistake 6: Using volume as a guarantee
No indicator guarantees outcomes. Volume is useful because it shows participation. It is not useful when beginners turn it into a prediction machine.
Action checklist
Before taking a volume-based chart idea seriously, ask:
- Is price near a meaningful support or resistance area?
- Is volume above or below recent average?
- Is volume confirming the direction of the move?
- Is the higher timeframe trend supportive?
- Did the breakout or pullback show follow-through?
- Is the idea invalidated at a clear level?
- Does the position size keep risk controlled?
- Is the setup clean, or is it stuck in chop?
If the answers are messy, the chart is probably messy too.
And messy charts are allowed to exist without your money involved.
Final takeaway
Volume analysis helps beginners stop reading candles in isolation.
It shows whether participation is expanding, fading, or behaving strangely around important levels. That makes it especially useful for reading breakouts, pullbacks, support, resistance, and trend quality.
The clean version: price shows the move, volume shows the participation behind the move.
Use volume as a confirmation tool. Pair it with structure. Respect risk. And don’t overcomplicate it.
A good chart does not need you to force a story.
Disclaimer
Educational content only. Not personalized financial advice or a recommendation to buy, sell, or hold any security. Trading and investing involve risk, including possible loss of capital.