
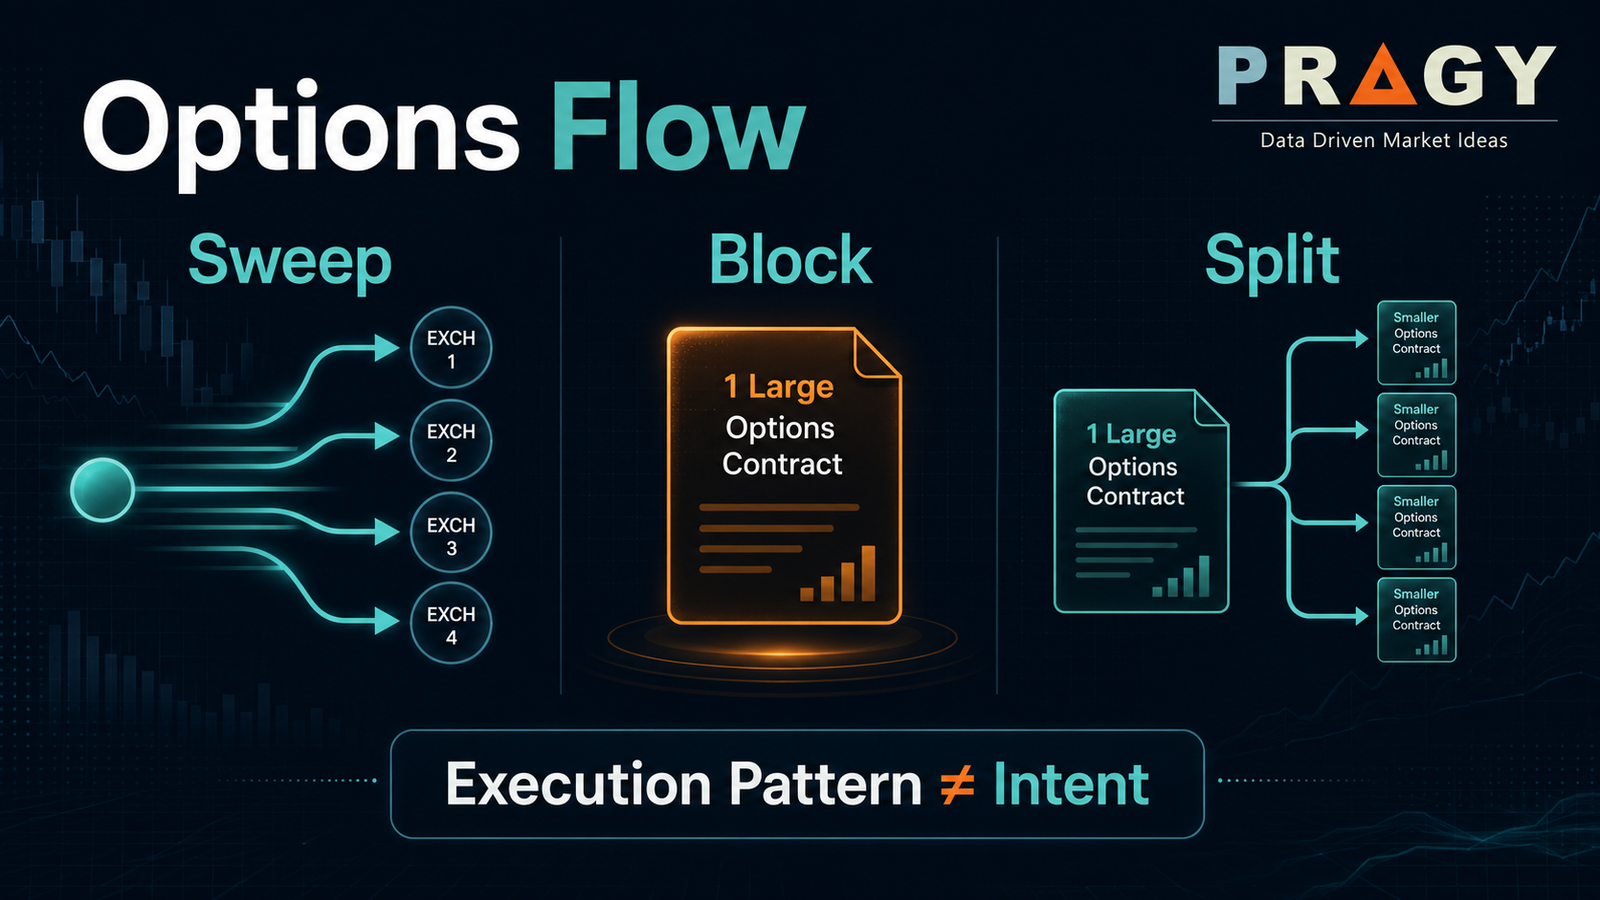
Options-flow scanners love dramatic labels.
Sweep. Block. Split.
They sound like secret institutional code. They can also make a beginner think, “Someone big knows something.”
Maybe. Maybe not.
Here’s the clean version: these labels describe how an order appears to have executed. They do not prove why the order happened.
That distinction matters. A sweep can be aggressive, but still wrong. A block can be large, but still hedged. A split order can look sneaky, but simply reflect fragmented liquidity or routine execution.
Flow is evidence. It is not a confession.
Here’s the simple version
In options flow:
- Sweep orders suggest urgency because the order appears to take liquidity across one or more venues or price levels.
- Block orders suggest size because a large number of contracts prints together or in a concentrated transaction.
- Split orders suggest fragmentation because a larger order appears broken into smaller pieces across time, exchanges, strikes, or executions.
The beginner mistake is treating those labels as automatic directional signals.
They are not.
A better question is:
What does the order label suggest, and what context supports or weakens that interpretation?
That is where actual research starts.
First, what is an options-flow “order” label?
When traders talk about options flow, they are usually looking at prints from the listed-options market: contract, strike, expiration, volume, premium, and sometimes execution clues like bid/ask location.
A scanner may classify the activity with labels such as:
- sweep
- block
- split
- spread
- unusual
- repeat
- opening or closing estimate
Useful? Yes.
Perfect? No.
These labels are interpretations of market data. They can help you notice activity faster, but they can also create false confidence.
Think of them as traffic signs, not GPS.
Sweep orders: urgency, not certainty
A sweep generally refers to an order that appears to move quickly through available liquidity, often across multiple exchanges or price levels.
In plain English: the trader wanted the order filled now, and the market had to “sweep” available contracts to complete it.
That can be interesting because aggressive execution may suggest urgency.
But urgency is not the same thing as directional certainty.
What a sweep may suggest
A sweep may point to:
- a trader prioritizing speed over perfect price
- a contract with limited available liquidity at the best quote
- an attempt to quickly establish or adjust exposure
- a reaction to news, volatility, or a price level
- a market participant working through several displayed offers or bids
Cboe’s options linkage guidance describes an Intermarket Sweep Order as a limit order for an options series where additional orders may be routed to execute against protected bids or offers across eligible exchanges. That helps explain why “sweep” activity is often associated with cross-market execution rather than one simple print in one place.
What a sweep does not prove
A sweep does not prove:
- the trader is right
- the order is opening a new position
- the order is purely directional
- the order is from an institution
- the order is not part of a spread
- the order is not a hedge
This is where people mess up.
A call sweep can look bullish. But it could be one leg of a call spread, a hedge against a short position, or a roll from an older position. A put sweep can look bearish. But it could be protection on a long stock book.
The label tells you about execution pressure. It does not tell you the full motive.
Block orders: size, not automatic conviction
A block order is a large options transaction that prints in a concentrated way.
In scanner language, a block often appears as a single large print or a very tight cluster. It can look cleaner than a messy sweep because the contracts appear together instead of scattered.
That size can matter. Large traders do not usually put on meaningful option exposure casually.
But “large” is relative.
A 2,000-contract block in a quiet small-cap name may deserve more attention than a 2,000-contract print in a mega-cap ETF where large options activity is routine.
What a block may suggest
A block may point to:
- a large participant entering, exiting, rolling, or hedging exposure
- institutional-style execution
- a negotiated or carefully worked transaction
- interest concentrated in one strike and expiration
- a position that may be meaningful if it is unusual relative to normal volume and open interest
What a block does not prove
A block does not prove:
- new positioning
- directional conviction
- urgency
- a clean long call or long put bet
- that the trader expects the stock to move immediately
A block may be a hedge. It may be closing activity. It may be a transfer of risk between two participants. It may also be one side of a larger structure.
The question is not, “Was it big?”
The better question is, “Was it big for that contract, that ticker, that expiration, and that market context?”
Split orders: one idea, many prints
A split order is a larger order that appears to execute in pieces.
This can happen because the market does not have enough liquidity at one price, because the order is algorithmically worked, because multiple exchanges are involved, or because the trader is intentionally reducing market impact.
A split order can show up as:
- several prints in the same contract within seconds or minutes
- repeated similar contract sizes at nearby prices
- activity spread across multiple exchanges
- a larger parent order broken into smaller child orders
- related activity across multiple strikes or expirations
Important note: “split order” is often a scanner or trader label, not a universal official category. Treat it as a pattern to investigate, not a formal verdict.
What a split order may suggest
A split order may point to:
- a larger participant working through available liquidity
- an attempt to avoid moving the market too aggressively
- hidden or partial liquidity interacting with the order
- a spread, roll, or multi-leg strategy being executed in pieces
- repeated interest in the same area of the options chain
Cboe’s discussion of hidden liquidity notes that exchanges may allow traders to hide part or all of an order to reduce market impact or limit how much position information is revealed. That broader market-structure idea is useful when reading split flow: not every large order appears as one obvious print.
What a split order does not prove
A split order does not prove:
- someone is hiding a guaranteed signal
- the order is bullish or bearish
- every print belongs to the same trader
- the trade is opening
- the trader is accumulating for a big move
Sometimes repeated prints are meaningful. Sometimes they are just the market filling available liquidity in chunks.
Do not romanticize the pattern.
The quick comparison
| Flow label | What it usually describes | What it may suggest | What it does not prove |
|---|---|---|---|
| Sweep | Fast execution through available liquidity | Urgency or aggressive order handling | Correct direction, new position, or institutional conviction |
| Block | Large concentrated transaction | Size, coordination, or institutional-style execution | Clean speculation, immediate catalyst, or one-sided belief |
| Split | Larger activity broken into pieces | Liquidity constraints, algorithmic execution, or reduced market impact | Hidden “smart money,” accumulation, or a guaranteed directional read |
The label is the first clue. The context is the work.
The context checklist that matters more than the label
Before reacting to a sweep, block, or split order, ask these questions.
1) Where did it execute relative to the bid and ask?
If a call trades near the ask, it may suggest aggressive buying. If it trades near the bid, it may suggest aggressive selling.
But “may” is doing heavy lifting.
Bid/ask interpretation can be distorted by fast markets, spreads, routing, multi-leg orders, and delayed quote data.
2) Is the flow single-leg or part of a spread?
This is the big one.
A call sweep by itself may look bullish. A call sweep paired with a higher-strike call sale may be a vertical spread. A put purchase paired with stock could be a hedge. A call sale paired with stock could be a covered-call strategy.
One leg without the rest of the structure can tell a very different story.
3) How does volume compare with open interest?
Volume measures contracts traded during a session. Open interest measures contracts that remain open or pending.
If volume is far above open interest, the order may indicate new activity. If open interest was already large, the print may involve closing, rolling, or transferring exposure.
OIC explains that volume and open interest measure different datasets: session activity versus cumulative open contracts.
4) Is the activity unusual for that ticker?
A 500-contract sweep may be notable in a thinly traded name.
A 500-contract sweep in a heavily traded index product may be ordinary.
Relative size matters more than raw size.
5) Is there a catalyst?
Check the calendar.
Is there earnings? A product event? An FDA date? A macro release? A shareholder vote? Index rebalancing? Sector news?
Flow around catalysts is often more complex because traders may be positioning for volatility, hedging risk, or monetizing elevated implied volatility.
6) What is implied volatility doing?
Implied volatility is the market’s estimate of expected movement. When implied volatility is elevated, options become more expensive.
A large premium print during high IV may look more dramatic than it really is.
The trade may be about volatility, not direction.
7) Does the chart location support the idea?
Options flow gets more interesting when it lines up with structure.
Examples:
- calls near a clean breakout area
- puts near a failed support zone
- repeat activity after a volatility compression
- flow near a major moving average or prior reaction level
Flow in the middle of messy chop is harder to interpret.
8) Is the activity repeated?
One print can be noise.
Repeated activity in the same contract, strike zone, or expiration can be more interesting, especially when it aligns with volume, open interest, catalyst, and price structure.
Still not proof. But stronger evidence.
Practical example: same ticker, three different labels
Let’s use a fictional stock called ABC, trading near $50.
No recommendation. No real ticker. Just mechanics.
Scenario A: Call sweep
A scanner shows:
- ABC $55 call
- 30 days to expiration
- 1,200 contracts
- executed across multiple exchanges within seconds
- mostly near the ask
- premium: $180,000
Beginner reaction:
“Bullish sweep. Someone knows ABC is going higher.”
Better interpretation:
“This appears aggressive and call-sided. Now check whether it is opening, whether open interest was low, whether there is a catalyst, whether it is part of a spread, and whether ABC is near a meaningful level.”
The sweep label makes it worth investigating. It does not finish the investigation.
Scenario B: Put block
A scanner shows:
- ABC $45 put
- 90 days to expiration
- 3,000 contracts
- one large block print
- premium: $900,000
- execution near the mid
Beginner reaction:
“Huge bearish bet.”
Better interpretation:
“This may be bearish, but it could also be a hedge, a roll, or a volatility structure. The mid-price execution makes directional aggressiveness less obvious. Check stock position context if available, open interest changes the next day, and whether there are related prints.”
The block is large. The motive is still unknown.
Scenario C: Split call activity
A scanner shows:
- ABC $52.50 calls
- same expiration
- repeated 100–250 contract prints over 15 minutes
- prices moving from $1.20 to $1.35
- total volume eventually exceeds 2,000 contracts
- open interest before the session was 180
Beginner reaction:
“Someone is accumulating secretly.”
Better interpretation:
“The repeated activity and volume-over-open-interest are interesting. But confirm whether the prints are tied to stock movement, whether other strikes are involved, and whether this is a spread or roll. It may be fresh interest, but that still does not make it a trade signal.”
Split flow can be useful. It can also be easy to over-narrate.
A practical reading framework: S.C.A.N.
Use this before assigning meaning to a sweep, block, or split order.
S — Structure
Is the order single-leg, multi-leg, part of a spread, or connected to stock?
No structure, no confidence.
C — Context
What is happening in the stock, sector, volatility, and catalyst calendar?
Flow without context is just expensive noise.
A — Activity
How does today’s volume compare with open interest and normal trading activity?
Unusual relative activity matters more than a big number by itself.
N — Next-day confirmation
What happens to open interest the next day?
Open interest updates can help separate possible new positioning from closing or rolling activity, though it still will not reveal motive with perfect certainty.
Common mistakes beginners make
Mistake 1: Treating “sweep” as automatically bullish or bearish
A sweep may show urgency. It does not show certainty.
Mistake 2: Ignoring the other legs
Many bad flow reads come from seeing one leg of a spread and building a story around it.
Mistake 3: Worshipping premium size
High premium can come from expensive underlying stocks, longer expirations, or elevated implied volatility.
Mistake 4: Forgetting hedging exists
Professional traders often use options to hedge, reduce risk, adjust exposure, or express volatility views.
Not every large order is a directional prediction.
Mistake 5: Skipping open interest
Volume alone can be misleading. Open interest helps frame whether activity might be new, closing, or transferred.
Mistake 6: Reading labels without reading the chart
A sweep into a strong technical level means something different from a sweep in the middle of chop.
Green flags and red flags
Green flags
A flow print becomes more useful when:
- volume is unusual versus open interest
- activity repeats in the same contract or nearby strikes
- the order appears aggressive and liquid enough to matter
- the stock is near a meaningful technical level
- the catalyst calendar explains why timing matters
- the flow is not obviously part of a neutral or hedged structure
- next-day open interest supports the idea that new contracts were opened
Red flags
Be careful when:
- only one leg of a spread is visible
- implied volatility is extremely elevated
- the bid/ask spread is wide
- the ticker already has massive daily options volume
- the print is large but ordinary for that product
- the activity appears right before earnings with no directional clarity
- the scanner label is the only reason the trade looks interesting
Final takeaway
Sweep, block, and split orders are useful labels, but they are not magic.
A sweep can suggest urgency.
A block can suggest size.
A split can suggest fragmented execution.
None of them prove intent.
The professional move is not to react to the label. It is to test the label against structure, context, activity, and next-day confirmation.
That is how options flow becomes research instead of storytelling.
Sources
Source checked: 2026-06-29.
- Cboe, Regulatory Circular RG09-117 — New Linkage Plan / Intermarket Sweep Orders: https://cdn.cboe.com/resources/regulation/circulars/regulatory/RG09-117.pdf
- Options Industry Council, Open Interest: Why It Matters: https://www.optionseducation.org/news/open-interest-why-it-matters
- Options Industry Council, Market Data: https://www.optionseducation.org/referencelibrary/market-data
- Cboe, Hide-and-Seek: Hidden Liquidity on U.S. Exchanges: https://www.cboe.com/insights/posts/hide-and-seek-hidden-liquidity-on-u-s-exchanges/
- FINRA, Trading Options: Understanding Assignment: https://www.finra.org/investors/insights/trading-options-understanding-assignment
- OCC, Characteristics and Risks of Standardized Options / options-risk notice: https://www.theocc.com/
Disclaimer
Pragy Investments provides financial education and market research only. This content is not investment advice, financial planning, portfolio management, tax advice, legal advice, or a recommendation to buy, sell, or hold any security. Examples and scenarios are for educational purposes only. Investing and trading involve risk, including possible loss of capital. Readers are responsible for their own decisions and should consult an appropriately qualified professional where needed. Options involve additional risks and may not be suitable for all investors. Options activity can reflect speculation, hedging, multi-leg strategies, volatility positioning, or other motives and does not by itself establish directional conviction.