
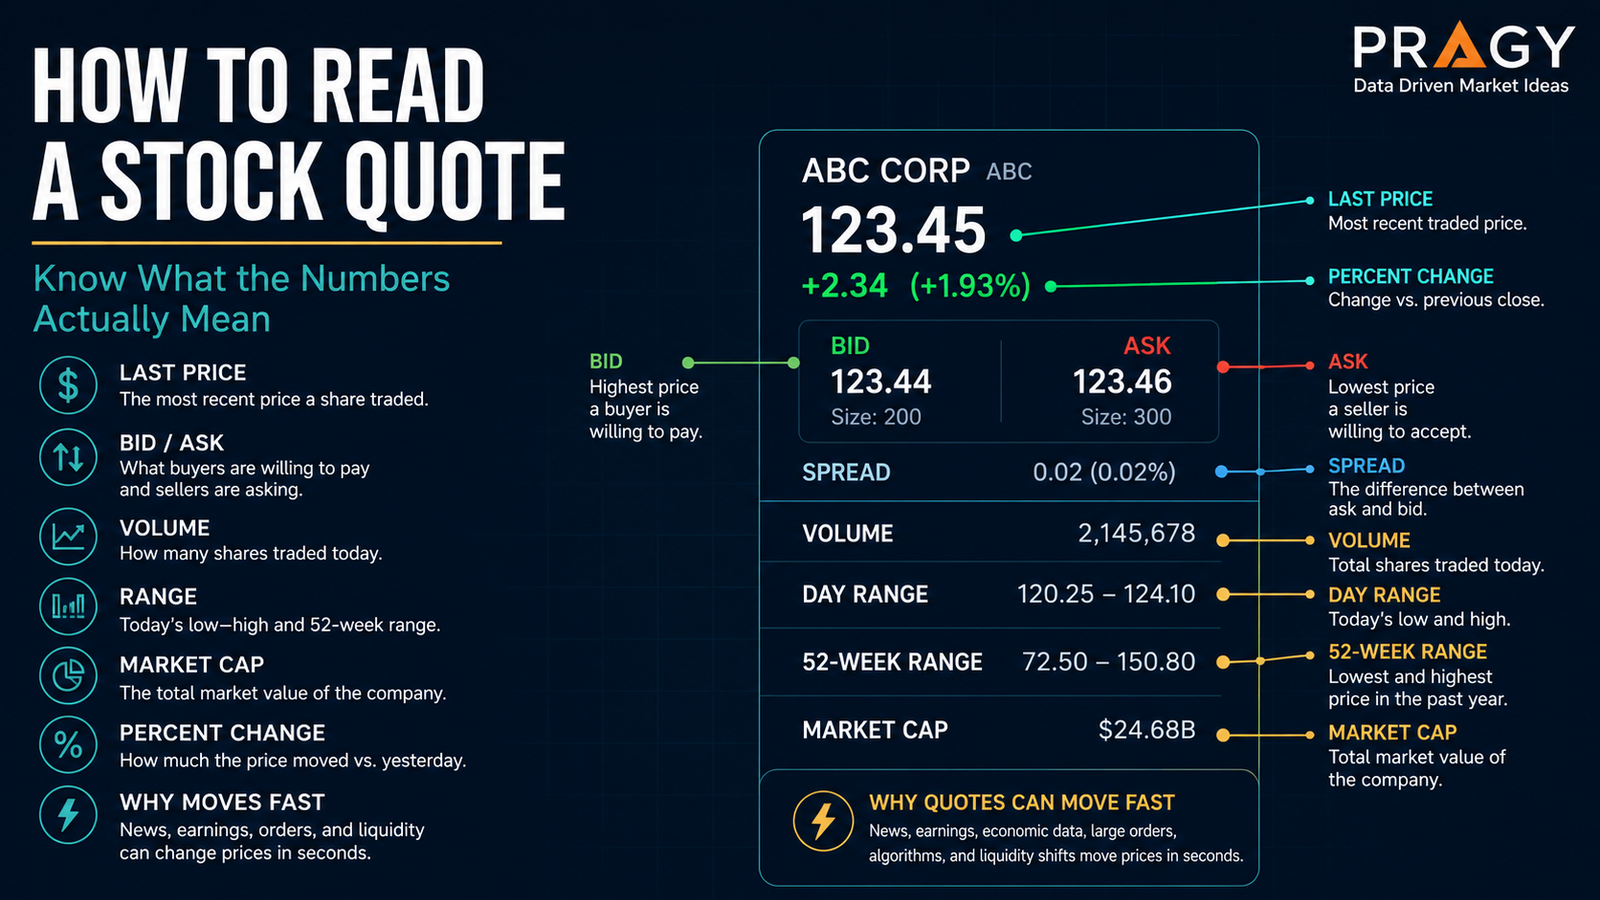
A stock quote looks simple until you actually stare at one.
There is a price. Then another price. Then a bid. An ask. A percentage. A range. Volume. Market cap. Suddenly, the “simple quote box” feels like a cockpit.
Here’s the deal: a stock quote is not a prediction. It is a snapshot of what the market is doing around a security at that moment.
Read it correctly, and you understand price, liquidity, activity, and context. Read it poorly, and you may confuse movement with meaning.
Here’s the simple version
A stock quote tells you:
- the last price where a trade happened
- what buyers are currently willing to pay
- what sellers are currently asking for
- how active the stock is
- how much the price has moved today
- where today’s price sits compared with the past year
- the company’s rough stock market value
The clean version: a quote helps you answer, “What is happening right now, and how does it compare to recent history?”
Last price: the most recent completed trade
The last price is the price of the most recent completed trade.
That sounds obvious, but this is where people mess up. The last price is not always the price you can trade at right now. It is a record of the last transaction.
If a stock quote shows a last price of $50.25, that means the most recent trade happened at $50.25. The next trade could happen higher or lower depending on the current bid, ask, and order flow.
The last price is useful because it gives you the market’s latest transaction point. But it is not the whole story.
Bid: what buyers are offering
The bid is the highest price buyers are currently willing to pay.
Example:
- Bid: $50.20
That means buyers are currently willing to pay up to $50.20 per share.
Think of the bid as the demand side of the quote. It shows where buyers are lined up right now. In a liquid stock, meaning a stock with lots of active buyers and sellers, the bid often sits close to the ask.
Ask: what sellers are asking
The ask is the lowest price sellers are currently willing to accept.
Example:
- Ask: $50.25
That means sellers are currently offering shares at $50.25.
Think of the ask as the supply side of the quote. If the bid is what buyers want to pay, the ask is what sellers want to receive.
Spread: the gap between bid and ask
The spread is the difference between the ask and the bid.
Formula:
Spread = Ask – Bid
Example:
- Bid: $50.20
- Ask: $50.25
- Spread: $0.05
A tight spread usually means the stock is more liquid. A wide spread can mean lower liquidity, higher volatility, or less agreement between buyers and sellers.
Liquidity means how easily something can be traded without causing a big price move. A highly liquid stock usually has many buyers and sellers. A less liquid stock may move sharply because fewer orders are available.
The trap: beginners often focus only on the last price and ignore the spread. That can lead to surprise execution prices, especially in fast-moving or thinly traded stocks.
Volume: how much trading is happening
Volume is the number of shares traded over a period of time, usually during the current trading session.
If a quote shows volume of 3,000,000, that means 3 million shares have traded so far during the session.
Volume helps you understand participation.
High volume can suggest strong interest, active news, institutional activity, or broad market attention. Low volume can suggest less participation, which may lead to wider spreads and choppier movement.
Chop is messy sideways price action where neither buyers nor sellers clearly control the move.
Volume does not tell you whether a stock is “good” or “bad.” It tells you how much activity is happening.
Day range: today’s high and low
The day range shows the lowest and highest prices traded during the current session.
Example:
- Day range: $49.80 – $51.10
That means the stock traded as low as $49.80 and as high as $51.10 during the day.
The day range helps you see where the current price sits inside today’s movement.
If the last price is near the high of the day, buyers may have been stronger during the session. If the last price is near the low of the day, sellers may have had more control. That is context, not a conclusion.
52-week range: the bigger picture
The 52-week range shows the lowest and highest prices traded over the past year.
Example:
- 52-week range: $38.50 – $64.00
This helps you zoom out. A stock trading near its 52-week high may be showing strength, but it may also be extended. A stock near its 52-week low may look “cheap,” but it may also be weak for a reason.
Red flag: assuming a stock is attractive just because it is down a lot.
Green flag: using the 52-week range as context, then checking trend, earnings, risk, and market conditions before forming an interpretation.
Market cap: the company’s stock market size
Market cap, short for market capitalization, is the company’s total stock market value.
Formula:
Market cap = Share price × shares outstanding
Example:
- Share price: $50
- Shares outstanding: 100 million
- Market cap: $5 billion
Market cap helps compare company size. A large-cap company is usually bigger and more established. A small-cap company is usually smaller and may be more volatile.
Volatility means how much and how quickly price moves. Higher volatility can create larger swings in both directions.
Do not overcomplicate it. Market cap is not a quality score. It is a size measure.
Percent change: today’s move compared with the previous close
Percent change shows how much the stock has moved compared with its previous closing price.
Formula:
Percent change = (Current price – previous close) ÷ previous close × 100
Example:
- Previous close: $50
- Current price: $52
- Percent change: 4%
That means the stock is up 4% from the previous close.
Percent change is useful because it puts the move in proportion. A $2 move on a $20 stock is very different from a $2 move on a $500 stock.
Why stock quotes can move fast
Stock quotes can move quickly because the market is constantly matching buyers and sellers.
A quote can change when:
- new orders enter the market
- existing orders get filled
- traders cancel or adjust orders
- news hits
- earnings results come out
- economic data changes expectations
- broader market indexes move
- liquidity dries up
- volatility increases
This is why the bid, ask, and last price may change several times in a short period.
The quote is not sitting still. It is reacting to supply, demand, information, and emotion.
Practical example: reading a quote without panicking
Imagine this quote:
| Quote item | Value |
|---|---|
| Last price | $50.25 |
| Bid | $50.20 |
| Ask | $50.25 |
| Spread | $0.05 |
| Volume | 2.4 million |
| Day range | $49.70 – $50.90 |
| 52-week range | $38.00 – $61.00 |
| Market cap | $8.5 billion |
| Percent change | +1.8% |
Here is how to read it:
The last trade happened at $50.25. Buyers are currently bidding $50.20, while sellers are asking $50.25. The spread is $0.05, which is relatively tight in this example. Volume is active enough to suggest real participation, not just a random price print.
The stock is trading near the upper half of its day range, so buyers have shown some intraday strength. It is still below its 52-week high, so the bigger picture needs more context.
The market cap tells you this is not a tiny company in this example, but it does not tell you whether the stock is attractive. The percent change tells you today’s move is positive compared with the previous close.
The key: you are building context, not making a decision from one number.
Common mistakes beginners make
Mistake 1: Treating the last price as the tradeable price
The last price is historical. The bid and ask show the current quote.
Mistake 2: Ignoring the spread
A wide spread can make entry and exit worse than expected. This matters even more in lower-volume stocks.
Mistake 3: Confusing volume with direction
High volume means high activity. It does not automatically mean the price will keep moving in the same direction.
Mistake 4: Thinking the 52-week low means “cheap”
A lower price does not automatically mean better value. Sometimes price is down because business conditions, earnings expectations, or market sentiment have weakened.
Mistake 5: Overreacting to percent change
A large percent move can be meaningful, but it needs context. Check volume, news, broader market conditions, and where the price sits in the day range.
Action checklist: how to read any stock quote
Before forming an opinion, check:
- Last price: Where did the most recent trade happen?
- Bid and ask: Where are buyers and sellers currently lined up?
- Spread: Is the gap tight or wide?
- Volume: Is trading activity normal, unusually high, or unusually low?
- Day range: Is price near today’s high, low, or middle?
- 52-week range: Is price near the top, bottom, or middle of its yearly range?
- Market cap: What size category is the company in?
- Percent change: How big is today’s move relative to the previous close?
- Speed: Is the quote moving quickly because of news, volatility, or thin liquidity?
Final takeaway
A stock quote is a market snapshot. It shows price, participation, and context.
The last price tells you where the most recent trade happened. The bid and ask show where buyers and sellers are currently positioned. The spread gives you a quick liquidity clue. Volume shows activity. Ranges help you compare today’s move with short-term and longer-term context.
The clean version: do not read one quote number in isolation. Read the whole quote like a dashboard for supply, demand, and movement.
Educational content only. This article is not personalized financial advice and is not a recommendation to buy, sell, or hold any security. Trading and investing involve risk, including possible loss of capital.
Disclaimer
Educational content only. Not personalized financial advice or a recommendation to buy, sell, or hold any security. Trading and investing involve risk, including possible loss of capital.