
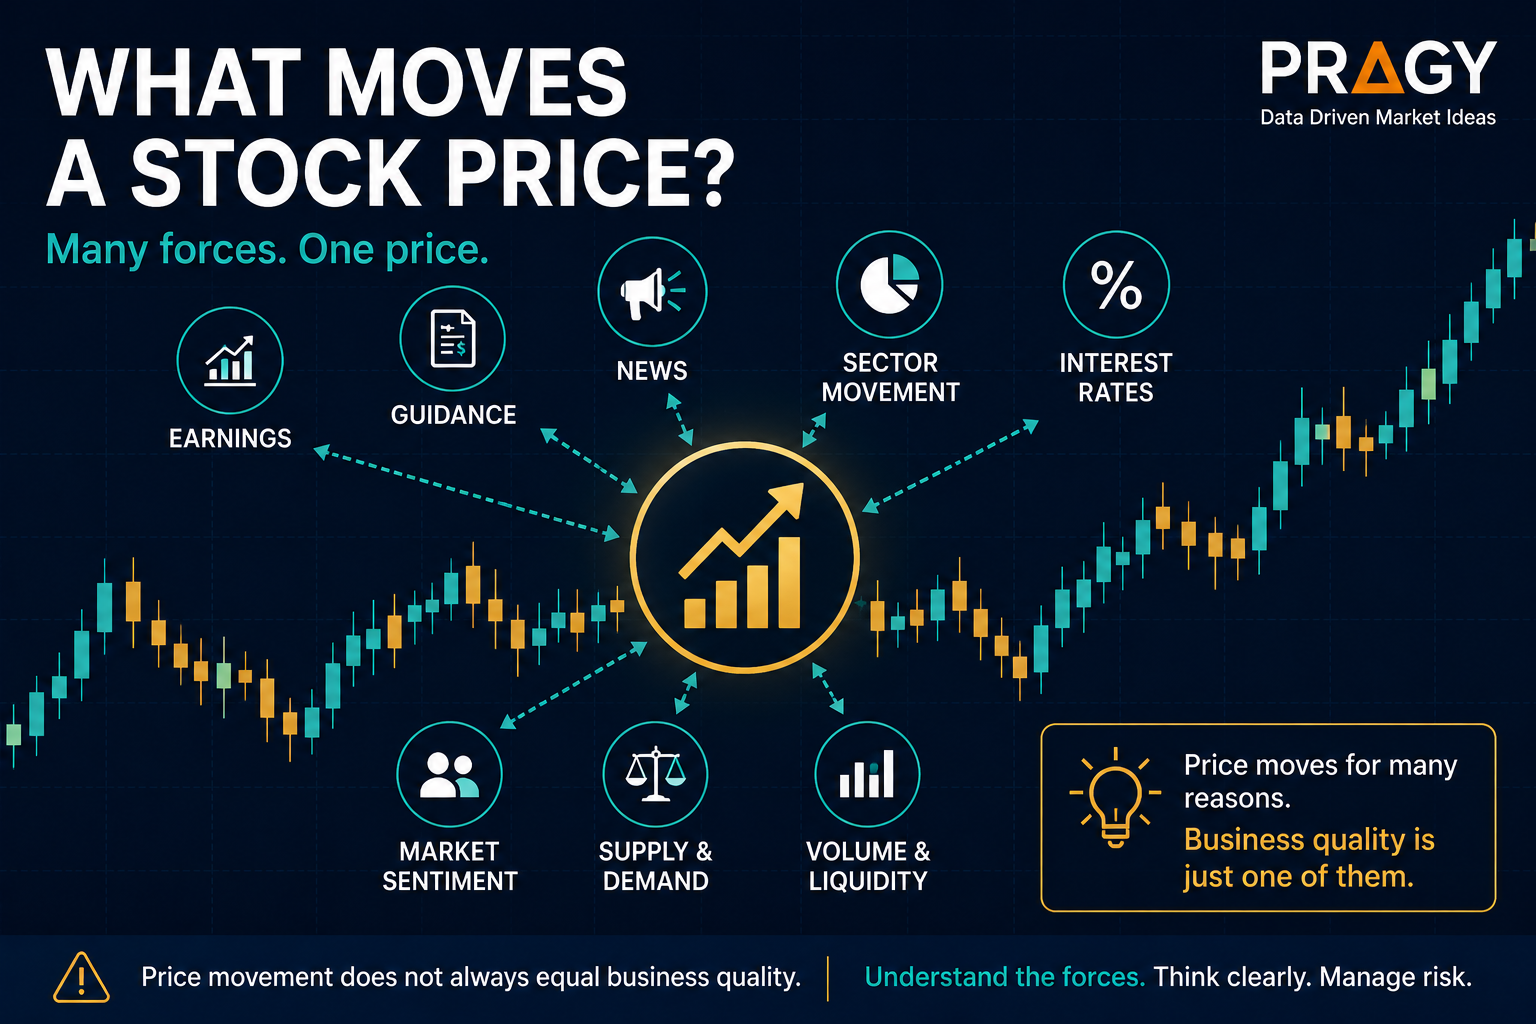
A stock price is not a personality test for a business.
It is a live auction.
Every trading day, buyers and sellers argue with money. One side thinks the stock is worth more. The other side thinks it is worth less, or has a better use for capital somewhere else. Price moves when that argument becomes unbalanced.
Here’s the deal: a stock can move because the company is improving. It can also move because expectations changed, interest rates shifted, a sector got hot, traders piled in, liquidity dried up, or the market simply changed its mood.
That is why beginners often get confused. They see a good company fall and assume something is broken. They see a weak company rally and assume something magical happened.
Neither has to be true.
Here’s the simple version
A stock price moves when supply and demand change.
More aggressive buyers than sellers? Price tends to rise.
More aggressive sellers than buyers? Price tends to fall.
Everything else is usually a reason behind that supply-and-demand shift: earnings, guidance, news, sector movement, interest rates, market sentiment, volume, liquidity, and expectations.
The clean version:
Business quality matters. Expectations matter more in the short term.
A great business can fall if investors expected perfection and got “only good.” A struggling business can jump if investors expected disaster and got “less bad.”
That does not mean fundamentals are useless. It means price movement is not always a clean report card.
Price is an auction, not a verdict
A stock trades because someone is willing to transact at a price.
That sounds obvious, but it is the foundation.
When people say, “The stock went up today,” what they really mean is:
Buyers were willing to pay higher prices, and sellers were not willing or able to stop them at lower levels.
When people say, “The stock dropped,” what they really mean is:
Sellers became more aggressive, buyers stepped back, or both.
Supply means the amount of shares available from sellers.
Demand means the amount of buying interest willing to absorb those shares.
If demand is strong and supply is limited, price can climb quickly. If supply is heavy and demand is weak, price can drop even when the long-term story still sounds attractive.
Don’t overcomplicate it. Every catalyst eventually has to show up as buying pressure, selling pressure, or a lack of either.
Earnings: the scheduled reality check
Earnings are one of the biggest stock-moving events because they update the market on how the company is actually performing.
An earnings report usually includes revenue, profit, margins, expenses, cash flow, and management commentary. For beginners:
Revenue is the money the company brings in from selling products or services.
Profit is what remains after costs.
Margins show how much of each dollar of revenue the company keeps after certain expenses.
The trap is thinking price moves only because the numbers were good or bad.
Price usually moves because the numbers were good or bad relative to expectations.
Example:
A company grows revenue 20%. Sounds strong. But if the market expected 30%, the stock may fall.
Another company reports a revenue decline. Sounds weak. But if the market expected a much worse decline, the stock may rally.
This is where people mess up: the market does not grade the report in isolation. It grades the report against the expectations already baked into the price.
Guidance: what management thinks comes next
Guidance is management’s outlook for future performance. It may include expected revenue, profit, margins, customer demand, costs, or broader business conditions.
Guidance can matter even more than the historical earnings numbers.
Why?
Because stocks often trade on what investors think will happen next.
A company can report a strong quarter but lower future expectations. That can pressure the stock.
A company can report a mixed quarter but raise its outlook. That can support the stock.
Green flag: the company beats expectations and raises guidance with a clear explanation.
Red flag: the company reports decent past numbers but warns that demand, margins, or cash flow may weaken.
Guidance is not a promise. It is a management estimate. But because the stock market is forward-looking, guidance can change the story fast.
News: new information changes the auction
News moves stocks when it changes what investors believe about future risk or reward.
Examples include:
- Product launches
- Regulatory updates
- Legal issues
- Management changes
- Mergers or acquisitions
- Analyst rating changes
- Major customer wins or losses
- Industry policy changes
- Supply chain problems
- Security incidents or operational disruptions
Not all news matters equally.
A headline may look dramatic but have little effect on long-term earnings. Another headline may look boring but quietly change the entire business outlook.
The question is not, “Is the headline exciting?”
The better question is:
Does this news change future cash flows, risk, valuation, or investor confidence?
If the answer is yes, price may react. If the answer is no, the move may fade once the initial attention passes.
Sector movement: stocks rarely trade alone
Stocks often move with their sector.
A sector is a group of companies in the same broad area of the economy, such as technology, energy, financials, healthcare, industrials, or consumer discretionary.
If the whole sector is rising, a stock may get pulled upward even without company-specific news.
If the sector is under pressure, even strong companies can get dragged lower.
Example:
An energy stock may move because oil prices changed.
A bank stock may move because interest rate expectations changed.
A semiconductor stock may move because demand expectations across the chip industry shifted.
The individual company still matters. But sector movement can create a tailwind or headwind.
The clean version: before assuming a stock moved because of company news, check whether its peers moved too.
Interest rates: the market’s gravity setting
Interest rates affect stocks because they influence borrowing costs, consumer behavior, business investment, and valuation.
When rates rise, borrowing can become more expensive for companies and consumers. That can pressure growth expectations.
Higher rates can also make future profits worth less in today’s terms. This matters especially for companies where investors are paying for growth expected far into the future.
When rates fall, borrowing may become easier, and future profits may look more valuable. That can support risk assets, depending on the economic backdrop.
Beginner translation:
Interest rates are like the market’s gravity setting.
Higher rates can make it harder for expensive or highly valued stocks to float.
Lower rates can make investors more willing to pay for future growth.
But context matters. Falling rates because inflation is cooling may be viewed differently from falling rates because the economy is weakening.
Market sentiment: mood can move money
Market sentiment means the overall attitude of investors and traders.
When sentiment is strong, people are often more willing to take risk. They may pay higher prices, chase breakouts, and look past bad news.
A breakout happens when price moves above resistance or below support with enough strength to matter. Resistance is an area where sellers have previously stepped in. Support is an area where buyers have previously stepped in.
When sentiment is weak, people may reduce risk, sell rallies, and react harshly to uncertainty.
This matters because the same news can produce different reactions in different environments.
In a confident market, “not bad” can be enough.
In a nervous market, “not perfect” can get punished.
The trap is treating every stock move as company-specific. Sometimes the whole market is simply risk-on or risk-off.
Supply and demand: the actual engine
Every price move comes back to supply and demand.
A stock rises when demand overwhelms available supply.
A stock falls when supply overwhelms available demand.
That sounds simple, but the forces behind it can be complex.
Demand can come from long-term investors, short-term traders, institutions, funds, index flows, option-related hedging, or momentum buyers.
Supply can come from profit-taking, fear, forced selling, fund rebalancing, short sellers, insiders, or investors rotating into other opportunities.
A pullback is a temporary move against the main trend. A pullback in a strong stock does not automatically mean the trend is broken. It may simply mean supply showed up after a strong run.
An invalidation level is the price area where the original idea no longer makes sense. For educational research, invalidation helps separate normal movement from a broken setup.
Price movement is not random noise all the time. But it is also not a perfectly clean story. It is a constant negotiation between buyers and sellers.
Volume and liquidity: how serious is the move?
Volume and liquidity help you judge the quality of a price move.
Volume means how many shares traded during a period.
Liquidity means how easily a stock can be traded without causing a large price change.
A move on strong volume may suggest broader participation. A move on weak volume may be easier to reverse because fewer shares changed hands.
Liquidity matters because thinly traded stocks can move sharply with relatively small orders. That can make price action look more meaningful than it really is.
A candlestick is a chart bar that shows where price opened, closed, and traveled during a time period. A wick is the thin line above or below a candlestick showing how far price moved before closing.
A stock that spikes upward but leaves a long upper wick may be showing that buyers pushed price higher, but sellers rejected the move before the close.
That does not automatically mean the stock is “bad.” It means the auction met supply at higher prices.
Volume and liquidity are not magic signals. They are context.
They help answer: was this move backed by real participation, or was it just a thin, messy burst?
Why price movement does not always equal business quality
This is the big lesson.
A stock is not the same thing as the company.
The company is the business: products, customers, revenue, profits, assets, debt, management, competition, and strategy.
The stock is a traded claim on that business, priced by the market every second.
Those are connected, but not identical.
A good company can have a falling stock because:
- Expectations were too high
- Valuation was stretched
- The sector is under pressure
- Interest rates moved against growth stocks
- Large holders are reducing exposure
- Guidance disappointed
- The market is in risk-off mode
A weaker company can have a rising stock because:
- Expectations were very low
- Results were less bad than feared
- Short sellers are covering
- The sector is rallying
- A news event changed the narrative
- Traders are chasing momentum
The clean version: price tells you what the market is doing. It does not always tell you the full truth about the business.
That is why smart market learners separate three questions:
- What is the business doing?
- What did the market expect?
- What is price confirming or rejecting?
Practical framework: the 7-question price move check
When a stock moves sharply, do not jump straight to a conclusion.
Use this simple framework.
1. Was there company-specific news?
Check whether earnings, guidance, leadership changes, legal updates, product news, or major business developments came out.
No news does not mean no reason. It just means the reason may be broader.
2. Did the sector move too?
Compare the stock to peers or a sector ETF.
If the entire group moved, the stock may be reacting to sector-level flows instead of its own story.
3. Did rates or macro conditions shift?
Macro means big-picture economic conditions like interest rates, inflation, employment, and growth.
Rate-sensitive stocks can move even without company news.
4. Was the move supported by volume?
Heavy volume can indicate stronger participation.
Light volume can mean the move needs more confirmation.
5. Is price near support or resistance?
If price is breaking above resistance or losing support, the technical context may matter.
A moving average is a line that smooths price over a chosen number of periods, helping traders see trend direction more clearly. It is not a prediction tool. It is a context tool.
6. What was already expected?
This is the sneaky one.
A great report can disappoint if expectations were too high. A weak report can support a rally if expectations were already washed out.
7. What would prove the interpretation wrong?
This is where risk thinking enters.
A common beginner guardrail is risking about 1% to 2% of total account size on a single trade idea. For example, with a $5,000 account, 1% risk equals $50 of planned risk.
That does not mean every idea deserves a trade. It means every serious market idea needs a risk framework before execution.
Execution means the actual process of entering, managing, and exiting a trade or investment plan.
Common mistakes beginners make
Mistake 1: Thinking good news always means green candles
Good news can already be priced in.
If everyone expected the company to crush earnings, a merely solid report may not be enough.
Mistake 2: Confusing price action with truth
Price is useful. Price is not perfect.
A stock can be mispriced, overreact, underreact, chop sideways, or move for reasons that are not obvious yet.
Chop is messy sideways price action where neither buyers nor sellers clearly control the move.
Mistake 3: Ignoring the sector
If the whole sector is falling, your stock may not be uniquely broken.
If the whole sector is rising, your stock may not be uniquely brilliant.
Mistake 4: Forgetting rates
Some stocks are more sensitive to interest rates than others. High-growth, highly valued, debt-heavy, or rate-sensitive businesses can react sharply to rate expectations.
Mistake 5: Treating volume like decoration
A breakout with weak volume deserves more caution than a breakout with broad participation.
Volume does not guarantee follow-through. Nothing does. But ignoring it removes important context.
Mistake 6: Skipping invalidation
An idea without invalidation can turn into a story you keep defending.
That is dangerous.
For beginners, a clean starting point is using the daily chart for the big picture and the 1-hour chart to refine the setup. A higher timeframe means zooming out to see the bigger trend before making a smaller entry decision.
Action checklist
Before forming a market opinion, ask:
- Did earnings or guidance change the story?
- Was there meaningful news, or just headline noise?
- Did the sector move in the same direction?
- Did interest rates or macro expectations shift?
- Is market sentiment risk-on or risk-off?
- Is price reacting near support, resistance, or a key moving average?
- Was the move backed by volume?
- Is liquidity strong enough to trust the move?
- What did the market expect before the move?
- What would prove the interpretation wrong?
This is not about predicting every tick.
It is about building a cleaner research process.
Final takeaway
Stock prices move because expectations, liquidity, and supply-demand pressure change.
Earnings matter. Guidance matters. News matters. Rates matter. Sentiment matters. Sector flows matter. Volume and liquidity matter.
But price movement does not always equal business quality.
A stock can fall because expectations were too high, not because the business is terrible. A stock can rise because expectations were too low, not because the business is suddenly elite.
The goal is not to explain every move perfectly. The goal is to avoid lazy conclusions.
Watch the business. Watch the expectations. Watch the price.
That is where real market learning begins.
Disclaimer
Educational content only. Not personalized guidance or a recommendation to buy, sell, or hold any security. Trading and investing involve risk, including possible loss of capital.