
Support and resistance sound fancy until you realize the idea is simple.
Markets remember areas.
Not perfectly. Not magically. But often enough that traders watch them.
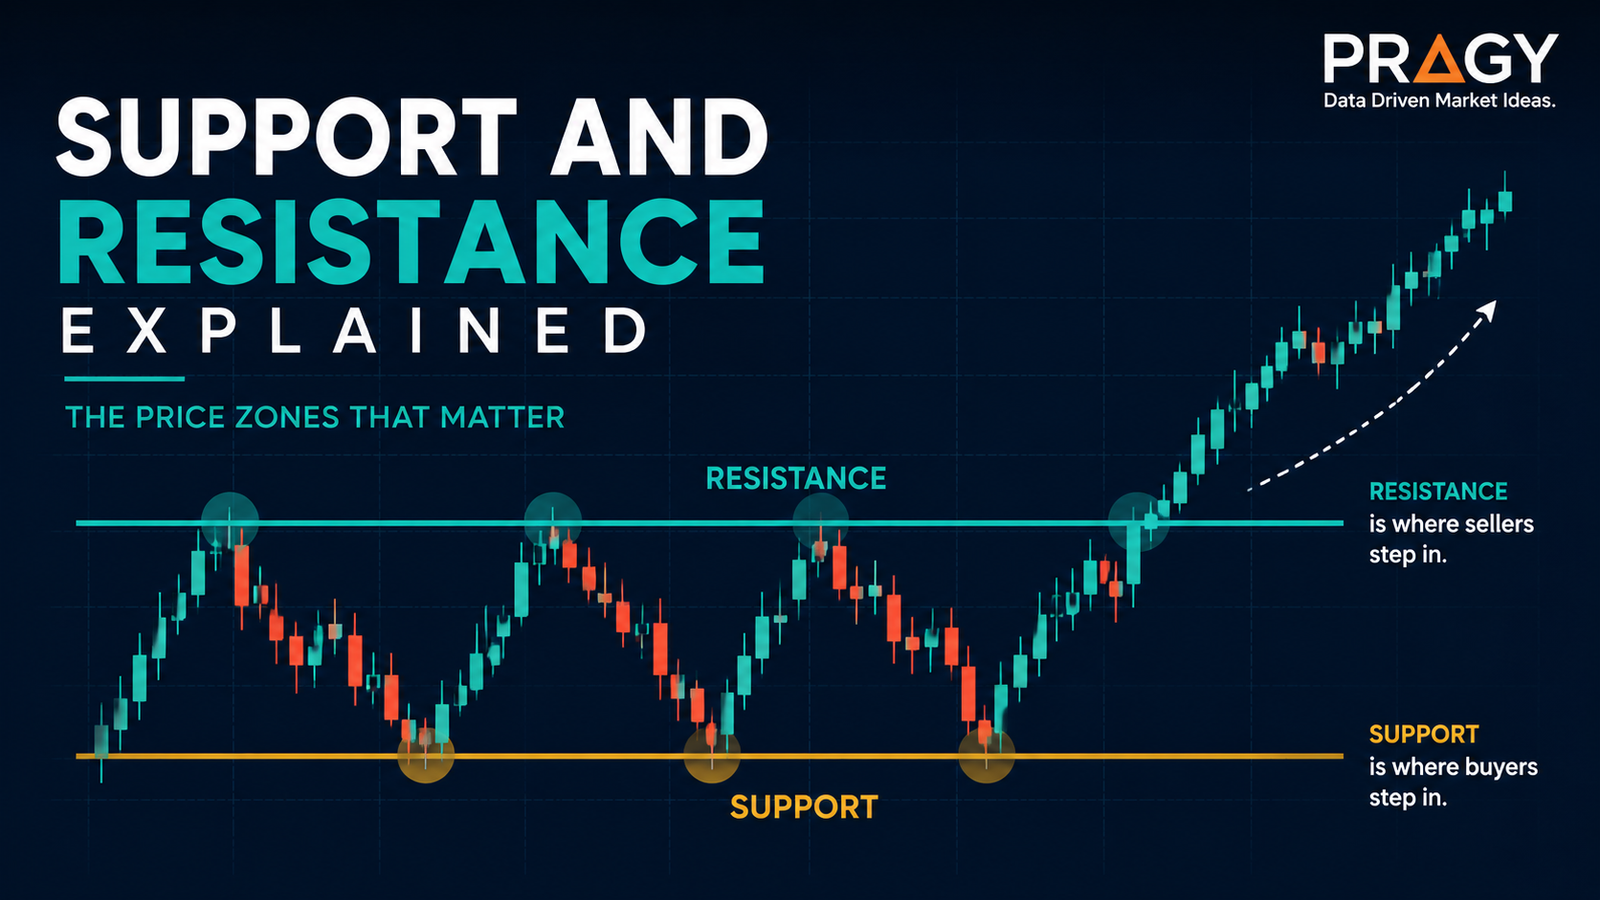
Support is an area where buyers have previously stepped in. Resistance is an area where sellers have previously stepped in. That’s the clean version.
The mistake beginners make is treating support and resistance like laser-thin lines that must hold to the penny. Real markets are messier than that. Levels are usually zones, not sacred numbers.
Here’s the deal: support and resistance help you organize a chart. They do not predict the future. They help you ask better questions.
Here’s the simple version
Support and resistance are price areas where the market has reacted before.
Support is like a floor area. Price falls into it, buyers show interest, and the move may slow down or reverse.
Resistance is like a ceiling area. Price rallies into it, sellers show interest, and the move may slow down or reverse.
That does not mean support always holds. It does not mean resistance always rejects price. It means those areas deserve attention because market participants have made decisions there before.
Think of them as decision zones.
A clean support or resistance level usually has three ingredients:
- Price reacted there before.
- The reaction was visible, not tiny noise.
- The level still matters on a useful timeframe.
Don’t overcomplicate it.
Why support and resistance matter
Support and resistance matter because they show where supply and demand may shift.
In plain English: they help you see where buyers and sellers may fight.
When price approaches support, traders may look for signs that buyers are defending the area. When price approaches resistance, traders may look for signs that sellers are defending the area.
But the key word is may.
A level is not a command. It is a context clue.
Support and resistance can help with:
- Planning possible entry areas
- Defining risk before a trade
- Avoiding random entries in the middle of nowhere
- Understanding where price may pause, reverse, or accelerate
- Reading market structure, which means the pattern of highs and lows on a chart
This is where people mess up: they draw a line, stare at it, and expect the market to obey.
The market does not care about your line.
Your job is to see whether price behavior confirms that the area still matters.
Support is a zone, not a magic line
Support is an area where buyers have previously stepped in.
A beginner might draw one exact line under a candle low and assume price must bounce there again. That is too rigid.
A better approach is to draw a zone around the area where price reacted. That zone may include candle bodies and wicks.
A candlestick is one price bar on a chart. The body shows where price opened and closed. The wick is the thin line above or below the candle showing how far price moved before closing.
Wicks matter because they show failed attempts. If price dipped below an area but quickly snapped back, that wick can show buyers rejected lower prices.
Green flag: price returns to support, slows down, forms higher lows, or shows stronger volume.
Volume means how many shares or contracts traded during a period. Higher volume near a level can suggest more participation.
Red flag: price slices through support with large candles and no meaningful reaction.
That usually means the level is weaker than beginners hoped.
Resistance works the same way in reverse
Resistance is an area where sellers have previously stepped in.
When price moves up into resistance, traders watch to see whether the rally stalls.
A clean resistance zone often forms near previous swing highs. A swing high is a visible peak on the chart where price stopped rising and turned lower.
Resistance can reject price, but it can also break.
A breakout happens when price moves above resistance or below support with enough strength to matter. The phrase “enough strength” is important because not every tiny push beyond a line is meaningful.
The trap is chasing every breakout candle without a plan.
A breakout is stronger when it comes with:
- A clean move above the zone
- A strong close beyond the level
- Increased volume
- Follow-through after the breakout
- A pullback that respects the old level
A pullback is a temporary move against the main trend. After a breakout above resistance, price may pull back toward the old resistance area. If that area holds, it may become new support.
That flip is one of the most useful support and resistance concepts.
Old resistance can become new support
Markets often retest important areas.
When price breaks above resistance, that old resistance zone can later act as support. Why? Because traders who missed the first move may wait for a pullback. Traders who were positioned the other way may exit. New buyers may step in.
Same idea in reverse.
When support breaks, the old support zone can later act as resistance.
This is called a role reversal.
The clean version:
- Resistance breaks → may become support
- Support breaks → may become resistance
Again, not guaranteed. Nothing in chart reading is guaranteed.
Support and resistance are not about certainty. They are about structure.
Use a higher timeframe before drawing levels
A higher timeframe means zooming out to see the bigger trend before making a smaller entry decision. For beginners, a clean starting point is using the daily chart for the big picture and the 1-hour chart to refine the setup.
Why does this matter?
Because a level on a 5-minute chart may look important until you zoom out and realize it is tiny noise.
Higher timeframe levels usually matter more because more traders and investors can see them.
A daily support zone is often more meaningful than a random intraday wiggle. That does not mean intraday levels are useless. It means beginners should start with the bigger map first.
A simple workflow:
Step 1: Start with the daily chart
Mark major swing highs and swing lows.
Look for areas where price clearly reacted more than once.
Step 2: Draw zones, not razor-thin lines
Use the candle bodies and wicks to create a reasonable area.
The zone should be useful, not microscopic.
Step 3: Drop to the 1-hour chart
Use the smaller timeframe to study how price behaves near the zone.
This helps avoid entering too early just because price touched a level.
Step 4: Define invalidation before the trade
Invalidation is the price level or area where the trade idea is no longer valid.
If your idea depends on support holding, then a decisive break below support may invalidate the idea. If your idea depends on resistance rejecting price, then a decisive move above resistance may invalidate the idea.
No invalidation means no real plan.
How to tell if a level is strong
Not all levels deserve your attention.
A stronger level usually has one or more of these traits:
Multiple reactions
Price has reacted at the area more than once.
One reaction can matter, but repeated reactions make the zone more visible.
Clean movement away from the level
A strong bounce or rejection suggests the market cared about that area.
Tiny, messy reactions are less useful.
Higher timeframe visibility
Daily and weekly levels often carry more weight than tiny intraday levels.
Freshness
A level that worked recently may be more useful than one from years ago, depending on the market and timeframe.
Confluence
Confluence means multiple signals line up in the same area.
For example, resistance may line up with a previous high, a moving average, and a downtrend line. A moving average is a line that smooths price over a set number of candles to show the average trend.
Confluence does not make a trade certain. It simply gives the area more context.
Breakouts, fakeouts, and chop
A breakout happens when price moves above resistance or below support with enough strength to matter.
A fakeout happens when price moves beyond a level, pulls in traders, and then quickly reverses back into the old range.
Beginners hate fakeouts. Professionals expect them.
Why do fakeouts happen?
Because markets are full of liquidity.
Liquidity means available orders in the market. Stops, entries, and exits often cluster near obvious levels. Price may push beyond those levels, trigger orders, and then reverse.
That is why obvious support and resistance areas can be messy.
Chop is messy sideways price action where neither buyers nor sellers clearly control the move. Support and resistance in chop can become frustrating because price may keep bouncing around without clean follow-through.
Red flag: you keep redrawing levels every five minutes to justify a trade.
Green flag: you can explain the level clearly before price gets there.
Practical example: reading a support zone
Imagine a stock has repeatedly bounced near $50.
Price falls to $50 three times over several weeks. Each time, buyers step in and price moves higher.
A beginner might say, “$50 is support.”
A cleaner version is: “The $49.50 to $50.50 area has acted as support because buyers previously stepped in there.”
Now price returns to that zone.
Instead of assuming it will bounce, you watch the behavior:
- Does price slow down?
- Are sellers losing momentum?
- Are buyers forming higher lows?
- Is volume increasing on the bounce?
- Is there a clear invalidation area?
This is analysis. Not prediction.
If price breaks below the zone with strength and fails to recover, support may no longer be support.
The level failed. The plan should adapt.
Risk still comes first
Support and resistance are not useful without risk management.
A stop loss is a planned exit level used to limit damage if the trade goes wrong. It is not a guarantee that losses will be small in every market condition, but it helps define risk before entering.
Position sizing means deciding how much money to risk on one trade before entering.
A common beginner guardrail is risking about 1% to 2% of total account size on a single trade idea. For example, with a $5,000 account, 1% risk equals $50 of planned risk.
Risk/reward compares the amount you are risking against the possible reward. For example, risking $50 to potentially make $100 is a 1:2 risk/reward idea.
The key is not finding a perfect level.
The key is asking:
“Does this level give me a clear place where the idea is wrong?”
That question protects beginners from random trades.
Common mistakes beginners make
Mistake 1: Drawing too many levels
If your chart looks like a barcode, you have a problem.
Too many levels create confusion. Mark the obvious areas first. If a level is not visible quickly, it may not be important enough.
Mistake 2: Treating levels as exact prices
Support and resistance are zones.
Price can wick through a level and still respect the area. A wick is not always a failure. Sometimes it is the market testing liquidity.
Mistake 3: Ignoring the trend
Support in an uptrend may behave differently from support in a strong downtrend.
A downtrend means price is making lower highs and lower lows. In that environment, support can keep breaking because sellers control the bigger picture.
Mistake 4: Chasing breakouts without confirmation
A candle poking above resistance does not automatically mean the breakout is clean.
Look for a strong close, volume, and follow-through.
Mistake 5: Forgetting the plan
A level is only useful if it helps define the trade idea.
Before entering any educational example setup, know the support zone, resistance zone, invalidation area, position size, and possible risk/reward.
Action checklist
Use this checklist before treating a level as meaningful:
- Can I explain why this level matters?
- Is it a zone, not a single magic price?
- Is it visible on a higher timeframe?
- Has price reacted there before?
- Is the market trending, ranging, or chopping?
- What would invalidate the idea?
- Where would risk be defined?
- Does the potential reward justify the risk?
- Am I reacting to price behavior or guessing?
The clean version: support and resistance should make your plan clearer. If they make your chart more confusing, simplify.
Final takeaway
Support and resistance are basic, but they are not beginner-only.
Good traders use them because they create structure. They show where price has mattered before and where decisions may happen again.
But the level itself is not the strategy.
The real skill is reading how price behaves around the level, using higher timeframe context, and defining risk before acting.
Don’t overcomplicate it.
Start with obvious zones. Watch reactions. Respect invalidation. Manage risk.
That is how support and resistance become useful instead of decorative.
Disclaimer
Educational content only. Not personalized financial advice or a recommendation to buy, sell, or hold any security. Trading and investing involve risk, and loss of capital is possible.