
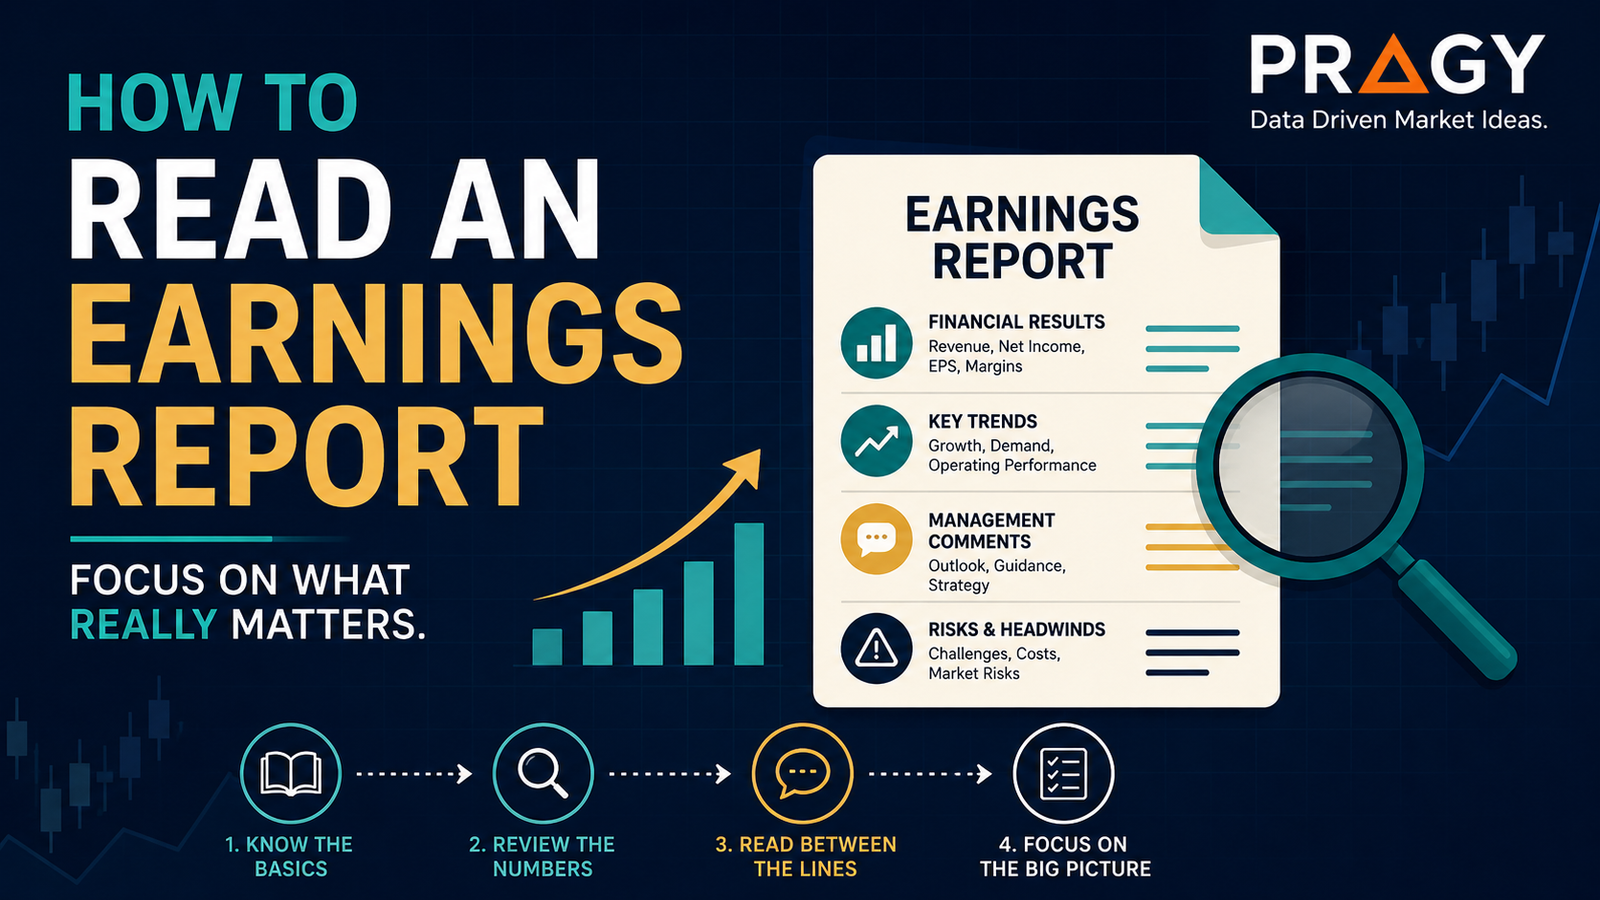
Earnings reports can look intimidating at first.
There are numbers everywhere. Revenue. EPS. Margins. Guidance. Cash flow. Adjusted this. Non-GAAP that. Then the stock moves 8% after hours and everyone pretends the reason was obvious.
Here’s the deal: you do not need to become an accountant to read an earnings report well.
You need a repeatable way to separate the signal from the noise.
An earnings report is basically a company’s report card. It tells you what happened during the quarter, how management explains it, and what the company thinks may happen next. The goal is not to predict the future perfectly. The goal is to understand the business better than someone who only reads the headline.
Here’s the simple version
When a public company reports earnings, focus on five questions:
- Did revenue grow?
- Did profits improve?
- Are margins expanding or shrinking?
- Is cash flow healthy?
- Did management raise, lower, or maintain guidance?
That is the clean version.
Everything else is context.
A company can “beat earnings” and still fall if guidance disappoints. A company can “miss EPS” and still rise if revenue quality improves or management gives strong forward commentary. The market reacts to expectations, not just numbers in isolation.
This is where people mess up: they treat earnings like a scoreboard instead of a story.
What is an earnings report?
An earnings report is a quarterly update from a public company showing its financial performance.
For U.S.-listed companies, the deeper filing is usually the Form 10-Q for quarterly reports and Form 10-K for annual reports. A Form 10-K is the audited annual report with a broad view of the company’s business and financial condition. A Form 8-K is a current report used to disclose major events shareholders should know about, and earnings releases are often attached to 8-K filings.
In plain English:
- Earnings release: the company’s polished summary.
- 10-Q: the quarterly filing with more detail.
- 10-K: the annual deep dive.
- 8-K: a current report for important updates.
Don’t overcomplicate it. For most beginners, start with the earnings release, then check the 10-Q or 10-K when you want the deeper version.
Step 1: Start with revenue
Revenue is the money the company brings in from selling products or services before expenses.
This is the top line.
Look at three things:
Year-over-year growth
Year-over-year means comparing this quarter to the same quarter last year.
If a company earned $10 billion in revenue this quarter and $8 billion in the same quarter last year, revenue grew 25%.
That matters because many businesses are seasonal. Comparing a retailer’s December quarter to its September quarter can be misleading. Comparing this December to last December usually tells a cleaner story.
Sequential growth
Sequential growth means comparing this quarter to the immediately previous quarter.
This can help you spot momentum, but be careful. Some companies naturally have strong and weak seasons.
Revenue quality
Revenue growth is good, but quality matters.
Green flag: revenue is growing because customer demand is stronger, pricing power is improving, or the company is expanding into a profitable segment.
Red flag: revenue is growing only because of heavy discounts, one-time deals, acquisitions, or unsustainable demand.
The trap: assuming all revenue growth is equal.
It is not.
Step 2: Read EPS without worshipping it
EPS, or earnings per share, is the company’s profit divided by the number of shares outstanding.
Example: if a company earns $1 billion and has 1 billion shares, EPS is $1.
EPS is useful because it shows profit on a per-share basis. But it can also be noisy.
Companies often report:
- GAAP EPS: based on standard accounting rules.
- Adjusted EPS: management’s version that removes certain items.
Adjusted EPS can be useful when it removes truly unusual events. But it can also make results look cleaner than they really are.
This is where people mess up: they read adjusted EPS like it is automatically better.
Ask this instead:
- What was adjusted out?
- Was it truly one-time?
- Does the company keep making the same “one-time” adjustments every quarter?
If a company has “one-time” charges all the time, they are not really one-time. They are part of the business pattern.
Step 3: Watch margins
A margin shows how much money the company keeps after certain costs.
The big three:
Gross margin
Gross margin shows how much is left after the direct cost of producing goods or services.
If revenue is $100 and direct costs are $40, gross profit is $60 and gross margin is 60%.
Rising gross margin may mean pricing power, better efficiency, or stronger product mix.
Falling gross margin may mean discounting, rising input costs, or weaker demand.
Operating margin
Operating margin shows profit after operating expenses like sales, marketing, research, and administration.
This tells you whether the company is running efficiently.
Net margin
Net margin shows how much profit is left after all expenses, interest, taxes, and other items.
This is the bottom-line view.
The clean version: revenue tells you if the company is growing. Margins tell you whether that growth is becoming more profitable.
Step 4: Check guidance
Guidance is management’s forecast or expectation for future performance.
This may include revenue, EPS, margins, capital spending, or other operating metrics.
Guidance matters because stocks often move based on what may happen next, not just what already happened.
A company can report strong current results but lower future guidance. That can pressure the stock.
A company can report mixed current results but raise guidance. That can support the stock.
The key is not just whether guidance went up or down. It is why.
Ask:
- Is demand improving or slowing?
- Are costs rising or falling?
- Is management confident or cautious?
- Did they change full-year expectations?
- Are they giving specific numbers or vague language?
Red flag: management avoids direct answers about demand, margins, or customer behavior.
Green flag: management explains both the strength and the risk clearly.
Step 5: Look at cash flow
Profit is important. Cash flow is harder to fake.
Cash flow shows how money actually moves in and out of the business.
The most useful line for beginners is usually operating cash flow, which shows cash generated from normal business operations.
Then look at free cash flow, which is commonly calculated as operating cash flow minus capital expenditures. Capital expenditures are investments in things like equipment, buildings, data centers, factories, or infrastructure.
Why does this matter?
Because a company can report accounting profits while burning cash.
That does not automatically mean the company is bad. Young growth companies often spend heavily. But you need to know what is happening.
The question is simple: is the business producing cash, consuming cash, or improving toward cash generation?
Step 6: Read the balance sheet like a risk check
The balance sheet shows what the company owns, owes, and keeps.
Focus on:
- Cash and short-term investments
- Debt
- Inventory
- Accounts receivable
- Share count
You do not need to memorize every accounting term.
Just ask: does the company have enough financial flexibility to handle a rough patch?
High debt is not always bad. Some stable businesses use debt responsibly. But high debt plus falling revenue plus shrinking margins can become a problem fast.
Also watch share count.
If the number of shares keeps rising, existing shareholders may be diluted. Dilution means each share represents a smaller ownership slice of the company.
Step 7: Compare expectations, not just results
Markets price expectations.
That means the stock reaction depends on what investors expected before the report.
A company may grow revenue 20%, but if the market expected 30%, the reaction can be negative.
A company may post a small decline, but if investors feared a disaster, the reaction can be positive.
This is why earnings reactions can look strange.
The headline might say “company beats earnings,” but the stock falls. Usually, the market found something else: weaker guidance, lower margins, slowing growth, cautious commentary, or valuation concerns.
Practical framework: the 10-minute earnings read
Use this simple flow before going deep.
Minute 1–2: Read the headline numbers
Check revenue, EPS, and guidance.
Do not make a conclusion yet.
Minute 3–4: Compare growth
Look at year-over-year revenue growth and whether growth is speeding up or slowing down.
Minute 5–6: Check margins
Are gross and operating margins expanding or shrinking?
Minute 7–8: Scan cash flow and debt
Is the company generating cash? Is debt manageable?
Minute 9: Read management commentary
Look for words about demand, pricing, costs, customers, backlog, and future expectations.
Minute 10: Write one clean sentence
Example:
“The company grew revenue, protected margins, and raised guidance, but cash flow weakened because spending increased.”
That one sentence is the win.
If you cannot summarize the quarter in one clear sentence, you probably do not understand it yet.
Common mistakes beginners make
Mistake 1: Only reading EPS
EPS is important, but it is not the whole report.
A company can beat EPS because of cost cuts while revenue is slowing. That may not be the same quality as profit growth driven by strong demand.
Mistake 2: Ignoring guidance
Guidance can matter more than the quarter itself.
The market is forward-looking. It cares about what the next few quarters may look like.
Mistake 3: Forgetting expectations
A “good” report can still disappoint if expectations were too high.
A “bad” report can still rally if expectations were extremely low.
Mistake 4: Trusting adjusted numbers blindly
Adjusted numbers are not automatically wrong. But they deserve a second look.
Ask what was removed and whether it keeps happening.
Mistake 5: Confusing stock reaction with business quality
One-day price action is not always a clean vote on long-term business quality.
Sometimes the stock moves because of positioning, options activity, valuation, or short-term expectations.
Price reaction is information. It is not the full story.
Action checklist
Before you form an opinion on an earnings report, check:
- Revenue growth versus last year
- EPS growth and the difference between GAAP and adjusted EPS
- Gross margin and operating margin direction
- Operating cash flow and free cash flow
- Debt levels and cash position
- Share count changes
- Guidance changes
- Management commentary
- Market expectations before the report
- The stock reaction after the report
Then write your one-sentence summary.
This keeps you from getting lost in the noise.
Final takeaway
Reading an earnings report is not about finding one magic number.
It is about connecting the numbers to the business story.
Revenue tells you whether the company is growing. Margins tell you whether growth is profitable. Cash flow tells you whether profits are converting into real money. Guidance tells you what management thinks comes next.
The trap is chasing headlines.
The better move is building a repeatable process.
Read the report. Compare the key numbers. Question the adjustments. Watch guidance. Then decide what the report actually says in plain English.
That is how you stop reacting to earnings noise and start understanding the business.
Disclaimer
Educational content only. Not financial advice, not a recommendation to buy, sell, or hold any security. Trading and investing involve risk, including possible loss of capital.