
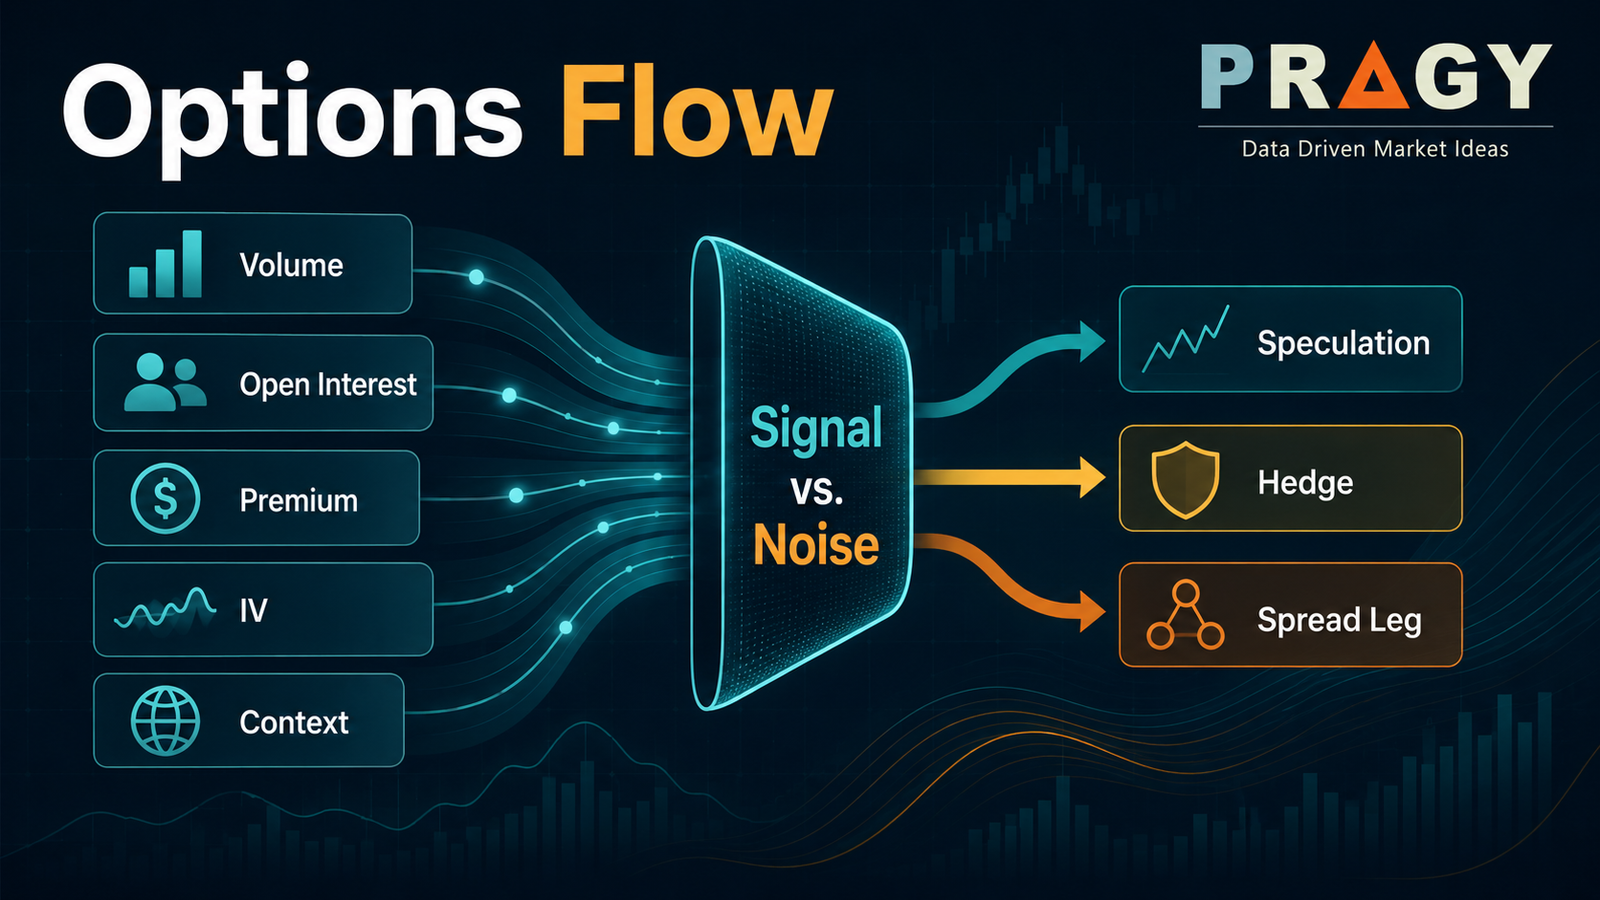
Options flow has a reputation problem.
A large call order hits the tape. Someone posts it online. The caption says, “Smart money knows.” A few rocket emojis appear. Suddenly, a normal market transaction gets treated like a secret message from Wall Street’s basement.
Here’s the clean version: options flow is useful, but it is not magic.
Options flow shows that an options contract traded. It may show size, premium, expiration, strike, call or put type, volume, open interest, implied volatility, and whether the trade looked aggressive. That can be valuable research context.
But flow does not automatically reveal why the trade happened.
It could be speculation. It could be hedging. It could be part of a spread. It could be a closing trade. It could be a market maker managing inventory. It could be noise wearing a fancy suit.
This article breaks down what options flow really means, what it does not prove, and how a self-directed learner can read it without turning every large trade into a prophecy.
Sources checked: June 29, 2026.
Here’s the simple version
Options flow is a record of options trading activity.
A flow scanner or options platform might show:
- The underlying stock or ETF
- Call or put
- Strike price
- Expiration date
- Contracts traded
- Premium paid or received
- Volume
- Open interest
- Bid, ask, and execution price
- Implied volatility
- Whether the order was a sweep, block, or unusual-size trade
That is the data.
The interpretation is separate.
A bullish-looking call trade may not be bullish. A bearish-looking put trade may not be bearish. A huge premium number may not mean a trader is “all in.” The flow is a clue, not a confession.
The better question is not:
“Is this flow bullish or bearish?”
The better question is:
“What possible positioning does this flow suggest, and what context would support or weaken that interpretation?”
That one sentence can save a lot of emotional clicking.
What options flow actually captures
At the most basic level, options flow captures transactions in listed options.
An option gives the buyer a right and the seller an obligation. A call gives the holder the right to buy the underlying asset at the strike price. A put gives the holder the right to sell the underlying asset at the strike price. The option seller receives premium and accepts the matching obligation if assigned.
That matters because every options trade has two sides.
When 1,000 call contracts trade, someone is on the long side and someone is on the short side. The tape may suggest which side acted more aggressively, but it does not hand you the trader’s strategy notes.
A flow print usually becomes interesting when one or more of these things appear:
| Flow element | What it tells you | What it does not tell you |
|---|---|---|
| Large contract size | A meaningful number of contracts changed hands | Whether the trade is directional |
| High premium | The trade involved meaningful dollar value | Whether the trader expects profit |
| Volume above open interest | Activity is large relative to existing contracts | Whether the position will remain open tomorrow |
| Near-ask call buying | A buyer may have acted aggressively | Whether it is speculation, hedge, or spread leg |
| Near-bid put selling | A seller may have acted aggressively | Whether risk is properly managed |
| Implied volatility increase | Option pricing became richer | Whether the underlying must move in one direction |
The trap is treating the final column like it does not exist.
The key vocabulary: volume, open interest, and premium
Before reading options flow, three terms need to be clean.
Volume
Volume is the number of option contracts traded during the current session.
If 4,000 contracts of the same strike and expiration trade today, today’s volume is 4,000 contracts. It resets each trading day.
Volume tells you activity happened. It does not automatically tell you whether new positions were opened or old positions were closed.
Open interest
Open interest is the number of outstanding option contracts that remain open.
Open interest does not update the same way intraday volume does. It is generally calculated after the trading day based on opening trades, closing trades, exercises, and assignments.
This is why “volume greater than open interest” gets attention. It can suggest fresh activity because today’s volume is larger than the number of contracts that were open before the session.
But even then, the smart move is patience. The next open-interest update helps confirm whether the activity actually increased outstanding contracts.
Premium
Premium is the option price multiplied by 100 shares per standard equity options contract, then multiplied by the number of contracts.
Example:
- 2,000 contracts
- $1.50 option price
- 100 shares per contract
That equals:
`2,000 × $1.50 × 100 = $300,000`
A $300,000 premium print may look important. Sometimes it is. But premium alone does not show whether the trade was a single-leg bet, a hedge, or one side of a larger strategy.
Big number. Still needs context.
Why “call buying = bullish” is too lazy
A call can express a bullish view. That part is true.
But a call trade can also be:
- A hedge against a short stock position
- One leg of a debit spread or credit spread
- A closing trade
- A volatility trade
- A market maker inventory adjustment
- A synthetic stock component
- A short call being bought back to reduce risk
That is why the phrase “someone bought calls, so they know something” is usually too simple.
Same with puts.
A put purchase can be bearish speculation, but it can also be downside protection on a long stock position. A put sale can reflect willingness to accept assignment, volatility selling, income strategy, or a spread leg. Without the surrounding structure, the directional story is incomplete.
Options flow is not useless. It is just easy to overread.
The signal-versus-noise framework
A cleaner way to read flow is to sort it into layers.
Layer 1: Activity
First, identify what traded.
Ask:
- What ticker?
- Call or put?
- Strike?
- Expiration?
- Contract size?
- Premium?
- Volume?
- Open interest?
This is the raw observation. No storytelling yet.
Layer 2: Aggression
Next, ask whether the trade appeared aggressive.
A trade closer to the ask may suggest buyer urgency. A trade closer to the bid may suggest seller urgency. A trade near the midpoint is less clear.
Even this is imperfect. Reported trade-side inference can be messy, especially in fast markets, multi-leg strategies, or delayed feeds.
Layer 3: Freshness
Then compare volume with open interest.
If today’s volume is much higher than prior open interest, the activity may represent new positioning. If volume is large but open interest was already large, the trade may be less unusual.
The next-day open-interest update is especially useful. If open interest rises meaningfully after a large flow print, the case for new positioning becomes stronger. If open interest barely changes or falls, some of the activity may have been closing, transferring, or part of a more complex structure.
Layer 4: Context
Now look beyond the contract.
Useful context may include:
- Upcoming earnings
- Product announcement
- Regulatory decision
- Sector momentum
- Major index movement
- Unusual stock volume
- Implied volatility change
- Chart location near support, resistance, or breakout zones
Support is an area where buyers previously stepped in strongly enough to slow or reverse a decline. Resistance is an area where sellers previously stepped in strongly enough to slow or reverse an advance.
If bullish call flow appears while price is stuck under major resistance and implied volatility is rising into earnings, the interpretation is different from bullish call flow appearing after a broad sector breakout with rising stock volume.
Same contract type. Different research context.
Layer 5: Risk
Finally, ask what the flow could be wrong about.
That sounds obvious, which is why people skip it.
A flow read can fail because:
- The trade was not directional
- The move already happened
- Implied volatility was too expensive
- The contract expires too soon
- The order was part of a spread
- The underlying stock moved against the idea
- Broader market conditions changed
- The data feed misclassified the trade
Good flow analysis does not ask, “How big could this be?”
It asks, “What would make this interpretation weaker?”
That is where actual research starts.
A practical example
Imagine a fictional stock, ABC, trading at $50.
An options scanner shows:
| Item | Observation |
|---|---|
| Contract | ABC 55 call |
| Expiration | 17 days away |
| Volume today | 2,500 contracts |
| Prior open interest | 200 contracts |
| Execution | Around $1.20 |
| Estimated premium | $300,000 |
| Trade location | Near the ask |
| Implied volatility | Rising |
The lazy version says:
“Big call buying. Bullish. Let’s go.”
The better version says:
“Large near-term call activity appeared in ABC, with volume well above prior open interest and execution near the ask. This may suggest aggressive upside interest, but the motive is unknown. The next open-interest update, implied-volatility behavior, stock-volume confirmation, and upcoming catalysts matter.”
That second version is less exciting.
It is also less likely to make a mess.
Possible interpretations
This flow could mean:
| Possible interpretation | Why it could fit | What would weaken it |
|---|---|---|
| Bullish speculation | Calls traded near the ask with volume above open interest | Open interest does not increase the next day |
| Hedge against short exposure | Calls can protect a short stock position | No evidence of short exposure or related position |
| Spread leg | One leg may print separately or appear more visible | Other related options trades appear nearby |
| Volatility positioning | Implied volatility may be the focus, not direction | IV falls sharply after the event |
| Closing activity | Existing shorts may be bought back | Open interest declines after the trade |
Notice the discipline: one observation, multiple possible explanations.
Options flow is most useful when it narrows research questions, not when it replaces them.
What makes options flow more interesting?
Not all flow deserves attention. Most flow is just market plumbing.
A flow print becomes more research-worthy when several conditions line up:
| Green flag | Why it matters |
|---|---|
| Volume far above open interest | Suggests activity may be fresh |
| Large premium relative to normal activity | Shows meaningful dollar value |
| Repeated activity across strikes or expirations | May suggest a broader positioning theme |
| Stock volume confirms | Underlying participation supports attention |
| Implied volatility behavior makes sense | Pricing confirms demand or expected movement |
| Clear catalyst window | The timing has a plausible reason |
| Chart context is clean | Price structure supports a scenario |
| Next-day open interest confirms | Helps separate opening activity from closing noise |
None of these proves anything alone.
Together, they can move a flow print from “interesting screenshot” to “research candidate.”
What makes options flow weaker?
Red flags matter just as much.
| Red flag | Why it weakens the read |
|---|---|
| Tiny premium | May be cheap lottery-ticket activity |
| Expiration is extremely close | Time decay can dominate fast |
| Trade prints at the midpoint | Directional aggressor may be unclear |
| Open interest was already huge | Activity may not be unusual |
| No follow-through in stock price or volume | Underlying market is not confirming |
| Implied volatility collapses | Option price can lose value even if direction is right |
| Likely spread activity | Single-leg interpretation may be misleading |
| Social-media hype is the main “source” | That is not research; that is noise with lighting |
Theta also matters here. Theta is the sensitivity of an option’s price to time passing. Short-dated contracts can lose extrinsic value quickly if the expected move does not happen soon.
So a flow print can be directionally right and still be a poor educational example of risk/reward if the option was expensive, crowded, or running out of time.
The “smart money” problem
The phrase “smart money” sounds useful because it gives uncertainty a costume.
But options flow rarely tells you who traded, why they traded, what else they own, how they are hedged, or whether they are closing risk.
A large institution might buy calls as part of a complex hedge. A retail trader might buy calls because a chart looked exciting. A market maker might take the other side and hedge with stock. A fund might use puts to protect a portfolio while remaining bullish on the underlying shares.
From the outside, the tape may look dramatic. The motive is still unknown.
A more accurate phrase is:
“This is unusual options activity that may deserve further research.”
Less dramatic. More useful.
A simple classification system
Instead of labeling every trade bullish or bearish, classify flow by research quality.
| Classification | Meaning | Example |
|---|---|---|
| Noise | Not enough size, context, or clarity | Small premium, unclear execution, no catalyst |
| Context | Useful background but not a standalone signal | Moderate activity in a sector already moving |
| Watchlist candidate | Worth tracking for confirmation | Volume above open interest with clean chart context |
| Real flow candidate | Multiple factors align | Large premium, fresh OI, catalyst, stock confirmation |
| High-risk flow | Interesting but fragile | Very short-dated contract, high IV, no margin for error |
This keeps the learner focused on process.
The goal is not to worship one print. The goal is to build a repeatable research filter.
Common mistakes beginners make with options flow
Mistake 1: Treating calls as always bullish and puts as always bearish
Calls and puts can express direction, hedging, income, volatility, spreads, or risk management. The contract type is only the first clue.
Mistake 2: Ignoring open interest
Volume tells you what traded today. Open interest helps show what remained open before or after activity. Without open interest, the flow read is half-dressed.
Mistake 3: Confusing premium with conviction
A large premium number is not automatically a large directional bet. It may be part of a larger package.
Mistake 4: Forgetting implied volatility
Options can lose value even when the underlying moves in the expected direction if implied volatility falls enough or the move is too slow.
Volatility is the size and speed of price movement. Implied volatility is the option market’s pricing of expected volatility. It is not a guarantee.
Mistake 5: Chasing delayed data
Some public tools provide delayed options data. Delayed data can still be useful for education and research review, but it should not be confused with real-time execution-quality information.
Mistake 6: Ignoring assignment risk
For short options, assignment risk matters. A short option seller may be required to fulfill the contract if assigned. That can mean delivering shares on a short call or buying shares on a short put, depending on the contract.
Mistake 7: Turning research into urgency
Good research slows the brain down. Bad flow content speeds it up.
If a flow post makes the reader feel late, desperate, or certain, that is a warning sign.
A clean options-flow checklist
Before treating a flow print as meaningful, run it through this checklist:
- Contract: What ticker, expiration, strike, and option type traded?
- Size: Was the contract volume meaningfully above normal activity?
- Premium: Was the dollar premium meaningful after accounting for contract size?
- Open interest: Was volume above prior open interest, and did next-day open interest confirm?
- Execution: Did the trade occur near bid, ask, or midpoint?
- Structure: Could it be part of a spread, hedge, or closing trade?
- Implied volatility: Did IV rise, fall, or stay stable?
- Underlying confirmation: Did stock price and volume support the interpretation?
- Catalyst: Is there an earnings date, event, sector move, or macro trigger?
- Risk: What would make the interpretation wrong or less useful?
The final question is the most important one.
Options flow should not be used to skip risk thinking. It should force better risk thinking.
Final takeaway
Options flow is not a crystal ball. It is a research input.
It can show where activity is building, which contracts are getting attention, how premium is moving, and whether open interest may be changing. That can help a learner spot unusual participation and ask better questions.
But flow does not prove direction. It does not reveal intent. It does not remove options risk. It does not turn delayed screenshots into a trading plan.
The cleanest mindset is this:
Options flow can point to where the market is active. Your job is to figure out whether that activity is signal, noise, hedge, spread, or trap.
That is less flashy than “smart money knows.”
It is also a lot more durable.
Sources
- Options Industry Council, Open Interest: Why It Matters
- Options Industry Council, Trending Options Volume
- Options Industry Council, General Information FAQ
- FINRA, Options
- FINRA, Trading Options: Understanding Assignment
- Investor.gov, Investor Bulletin: An Introduction to Options
Disclaimer
Educational content only. Not investment advice, financial planning, tax advice, legal advice, or a recommendation to buy, sell, or hold any security.