
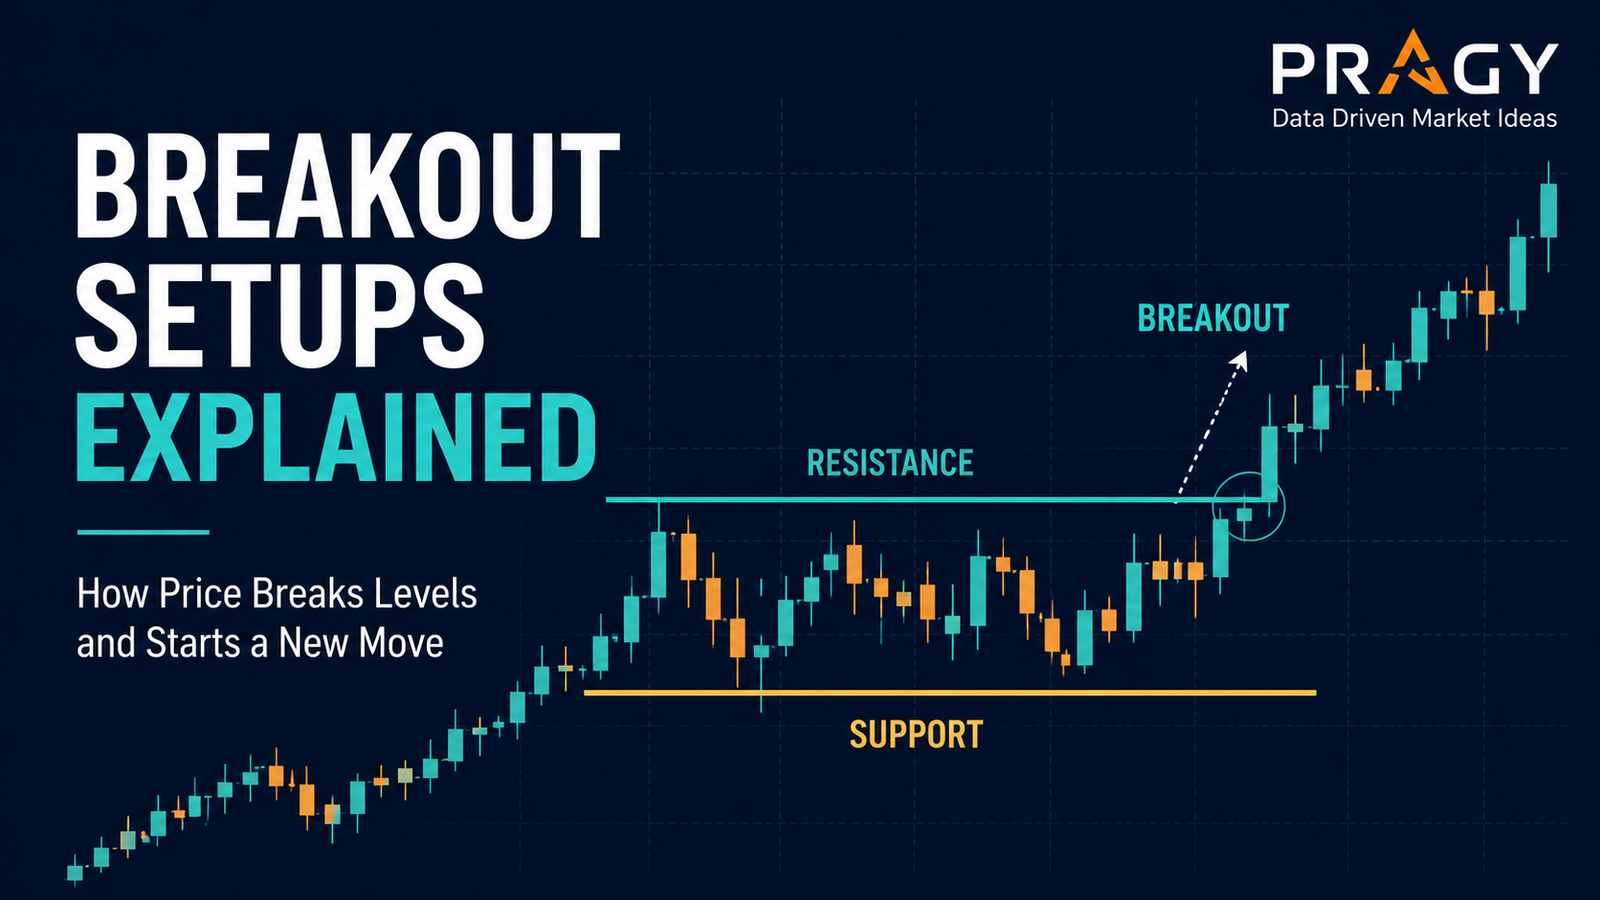
Breakouts are one of the most popular trading setups because they look clean.
Price pushes through a key level. Momentum shows up. Everyone suddenly has an opinion.
Here’s the deal: a breakout is not automatically a good trade idea. Sometimes it is a real shift in demand. Sometimes it is a fake move designed to punish late entries. The skill is not memorizing the word “breakout.” The skill is reading the context around the move.
This article breaks down breakout setups in a beginner-friendly way, without turning your chart into a spaceship dashboard.
Here’s the simple version
A breakout happens when price moves above resistance or below support with enough strength to matter.
Resistance is an area where sellers have previously stepped in.
Support is an area where buyers have previously stepped in.
A bullish breakout means price pushes above resistance. A bearish breakout means price falls below support. The basic idea is simple: once price clears an important level, the market may be showing that control has shifted.
The clean version:
- Find the key level.
- Wait for price to break it.
- Check whether the move has real participation.
- Plan the risk before thinking about the reward.
- Avoid chasing messy candles in emotional conditions.
Don’t overcomplicate it. A breakout setup is just a battle for control at a visible price level.
What makes a breakout level worth watching?
Not every line on a chart deserves your attention.
A useful breakout level usually has three qualities.
1. The level is obvious
If you need seven trend lines, three indicators, and a motivational quote to explain the level, it is probably not clean.
A better breakout level is visible quickly. Price has reacted there before. Buyers or sellers clearly cared about that area.
Examples:
- Price rejected the same resistance zone multiple times.
- Price bounced from the same support zone several times.
- Price consolidated under a level before pushing through.
- Price formed a tight range where one side eventually gave up.
A range is sideways price action between support and resistance. A range breakout happens when price leaves that sideways box with strength.
2. The higher timeframe supports the idea
A higher timeframe means zooming out to see the bigger trend before making a smaller entry decision. For beginners, a clean starting point is using the daily chart for the big picture and the 1-hour chart to refine the setup.
This is where people mess up. They see a breakout on a small chart but ignore the bigger trend.
A breakout above resistance is usually cleaner when the higher timeframe is already trending upward or building a strong base. A breakout below support is usually cleaner when the higher timeframe is weak or losing structure.
That does not make the setup guaranteed. It just means the idea has better context.
3. The market is not stuck in chop
Chop is messy sideways price action where neither buyers nor sellers clearly control the move.
Breakouts inside chop are dangerous because price often pokes above a level, pulls traders in, then snaps back into the range. That is how false breakouts are born.
A green flag is compression before expansion. Price tightens near a level, volume dries up, then participation expands as price breaks.
A red flag is random candle chaos. Big wicks. No clean structure. Price flying in both directions. Emotional entries everywhere.
The parts of a breakout setup
A breakout setup has more than one candle.
Think of it as a small process.
The level
This is the support or resistance zone that matters.
Use zones, not razor-thin lines. Markets are not perfect geometry. A resistance zone might sit around $50 to $51, not exactly $50.00.
The trigger
The trigger is the event that gets the setup under observation.
For example, price closes above resistance instead of only wicking through it.
A candlestick shows the open, high, low, and close for a period of time. A wick is the thin line above or below a candlestick showing how far price moved before closing.
The close matters because it shows where price finished, not just where it briefly traveled.
The confirmation
Confirmation does not mean certainty. It means the move has enough evidence to study.
Common confirmation clues include:
- A strong close beyond the level
- Higher-than-normal volume
- A successful retest of the breakout area
- A higher low after breaking resistance
- A lower high after breaking support
- Broad market conditions supporting the direction
Volume means the number of shares or contracts traded. Higher volume can suggest more participation behind a move.
Liquidity means how easily something can be traded without price moving wildly. Breakouts in low-liquidity conditions can be jumpy, especially for beginners.
The entry style
There are two common educational entry styles.
The first is the break-and-hold approach. Price breaks through the level, closes beyond it, and holds that area.
The second is the pullback retest approach. A pullback is a temporary move against the main trend. In this case, price breaks above resistance, then pulls back to test that old resistance as potential new support.
Neither style is perfect. The break-and-hold approach can enter earlier but may face more fakeouts. The pullback approach can be cleaner but may miss moves that never retest.
The trap is thinking one method is magic. The better question is: where is the trade idea wrong?
Invalidation: the level beginners ignore
Invalidation is the price level or area where the trade idea is no longer valid.
For a bullish breakout, invalidation might be price falling back below the breakout zone and failing to reclaim it.
For a bearish breakdown, invalidation might be price reclaiming the broken support area.
A stop loss is a planned exit level used to limit damage if the trade goes wrong. It should be connected to the setup, not placed randomly because the trader is uncomfortable.
Bad invalidation: “I’ll exit when it feels bad.”
Better invalidation: “If price closes back inside the old range and cannot reclaim the breakout level, the breakout idea is no longer clean.”
That is a risk framework, not a prediction.
Position sizing keeps the setup from becoming personal
Position sizing means deciding how much money to risk on one trade before entering.
A common beginner guardrail is risking about 1% to 2% of total account size on a single trade idea. For example, with a $5,000 account, 1% risk equals $50 of planned risk.
This matters because breakout setups can fail quickly.
Say this is an educational example:
- Account size: $5,000
- Planned risk: 1% = $50
- Breakout level: $50
- Invalidation area: $48.75
- Risk per share: $1.25
- Position size based on planned risk: $50 ÷ $1.25 = 40 shares
This does not mean the trade is good. It means the risk is defined before the entry.
That is the difference between execution and impulse.
Risk/reward: useful, but not enough
Risk/reward compares the amount you are willing to risk with the possible upside in a setup.
A 2:1 risk/reward idea means the possible reward is twice the planned risk. For example, risking $1 to potentially make $2.
Green flag: the next resistance area gives the setup enough room to move.
Red flag: price breaks out directly into another major resistance level. That leaves little space before sellers may show up again.
Risk/reward should be realistic. Not every breakout needs a moonshot target. Some setups have clean room. Others are cramped.
A simple breakout framework
Use this as an educational checklist before placing any breakout setup under observation.
Step 1: Start with the higher timeframe
Is the bigger chart trending, basing, or breaking down?
Daily chart first. Then refine with the 1-hour chart.
The daily chart gives context. The 1-hour chart helps with timing. Beginners should avoid making small-chart decisions without understanding the bigger structure.
Step 2: Mark the level
Find the support or resistance area that price has respected before.
Keep it clean. One or two important levels are better than ten confused lines.
Step 3: Wait for the break
Do not assume the breakout before it happens.
A setup under observation is not the same as a trade idea in execution.
Step 4: Check the quality of the break
Ask:
- Did price close beyond the level?
- Did volume expand?
- Was the candle clean or full of rejection wicks?
- Is the broader market helping or fighting the move?
- Is the move happening in clean trend conditions or chop?
Step 5: Define invalidation
Before thinking about upside, define where the idea fails.
This is the line between trading a framework and chasing a feeling.
Step 6: Size the risk
Use planned risk, not excitement.
If the invalidation level is far away, the position size should usually be smaller. If the setup requires too much risk for the account, skipping it is a valid decision.
Step 7: Plan execution
Execution means how you actually enter, manage, and exit the idea.
Execution includes entry style, stop placement, position size, possible target areas, and what you will do if price immediately fails.
The best breakout plan is boring before it becomes active.
Educational example: the breakout-and-retest idea
Imagine a stock has rejected the $50 to $51 zone three times.
Price then compresses under that zone for several sessions. Volatility slows down. Volatility means how much price moves over a period of time. Lower volatility near resistance can show pressure building.
Then price closes above $51 with expanded volume.
A beginner might chase the first big candle.
A more structured approach might be:
- Mark $50 to $51 as the breakout zone.
- Wait to see whether price holds above that zone.
- Watch for a pullback into the old resistance area.
- Look for buyers to defend that area as potential new support.
- Define invalidation below the failed retest area.
- Size the position based on planned risk.
- Avoid the idea if price falls back into the old range with heavy selling.
The point is not that the setup will work. The point is that the decision has structure.
Common breakout mistakes
Mistake 1: Chasing the first candle
The first breakout candle is often the most emotional candle.
Sometimes it continues. Sometimes it traps late buyers.
A big candle alone is not a plan.
Mistake 2: Ignoring the close
A wick through resistance is not the same as a close above resistance.
Wicks show where price traveled. Closes show where price settled.
Mistake 3: Treating every level as important
Too many lines create fake confidence.
The market does not care about your chart decoration.
Mistake 4: Forgetting volume
Breakouts with weak volume can still work, but they deserve more caution.
Volume helps show whether the move has participation behind it.
Mistake 5: No invalidation
Without invalidation, the setup becomes a hope trade.
Hope is not a risk management system.
Mistake 6: Oversizing
A good-looking setup can still fail.
Position sizing protects you from turning one failed idea into a major account problem.
Mistake 7: Trading breakouts in bad conditions
Breakouts are harder in choppy markets, low-liquidity names, and news-driven volatility.
The setup matters. The environment matters too.
Action checklist
Before studying a breakout setup, ask:
- Is the breakout level obvious?
- Is the higher timeframe supportive?
- Is price breaking from clean structure or messy chop?
- Did price close beyond the level?
- Is volume supporting the move?
- Is there room before the next major level?
- Where is invalidation?
- What is the planned risk?
- Does the position size match the account risk limit?
- What is the execution plan if price immediately fails?
If you cannot answer those questions, the setup is not ready.
Final takeaway
Breakout setups are simple to spot and easy to mishandle.
The beginner mistake is chasing price because it moved through a line. The better approach is to read the structure, confirm participation, define invalidation, and size the risk before execution.
A breakout is not a prediction. It is a possible scenario.
Treat it like a framework, not a promise.
Disclaimer
Educational content only. Not personalized financial advice. Trading and investing involve risk, including possible loss of capital.