
Most beginners look at a company and ask one big question:
“Is this business doing well?”
Fair question. But the answer usually starts with three boring-sounding words that carry a lot of weight: revenue, earnings, and margins.
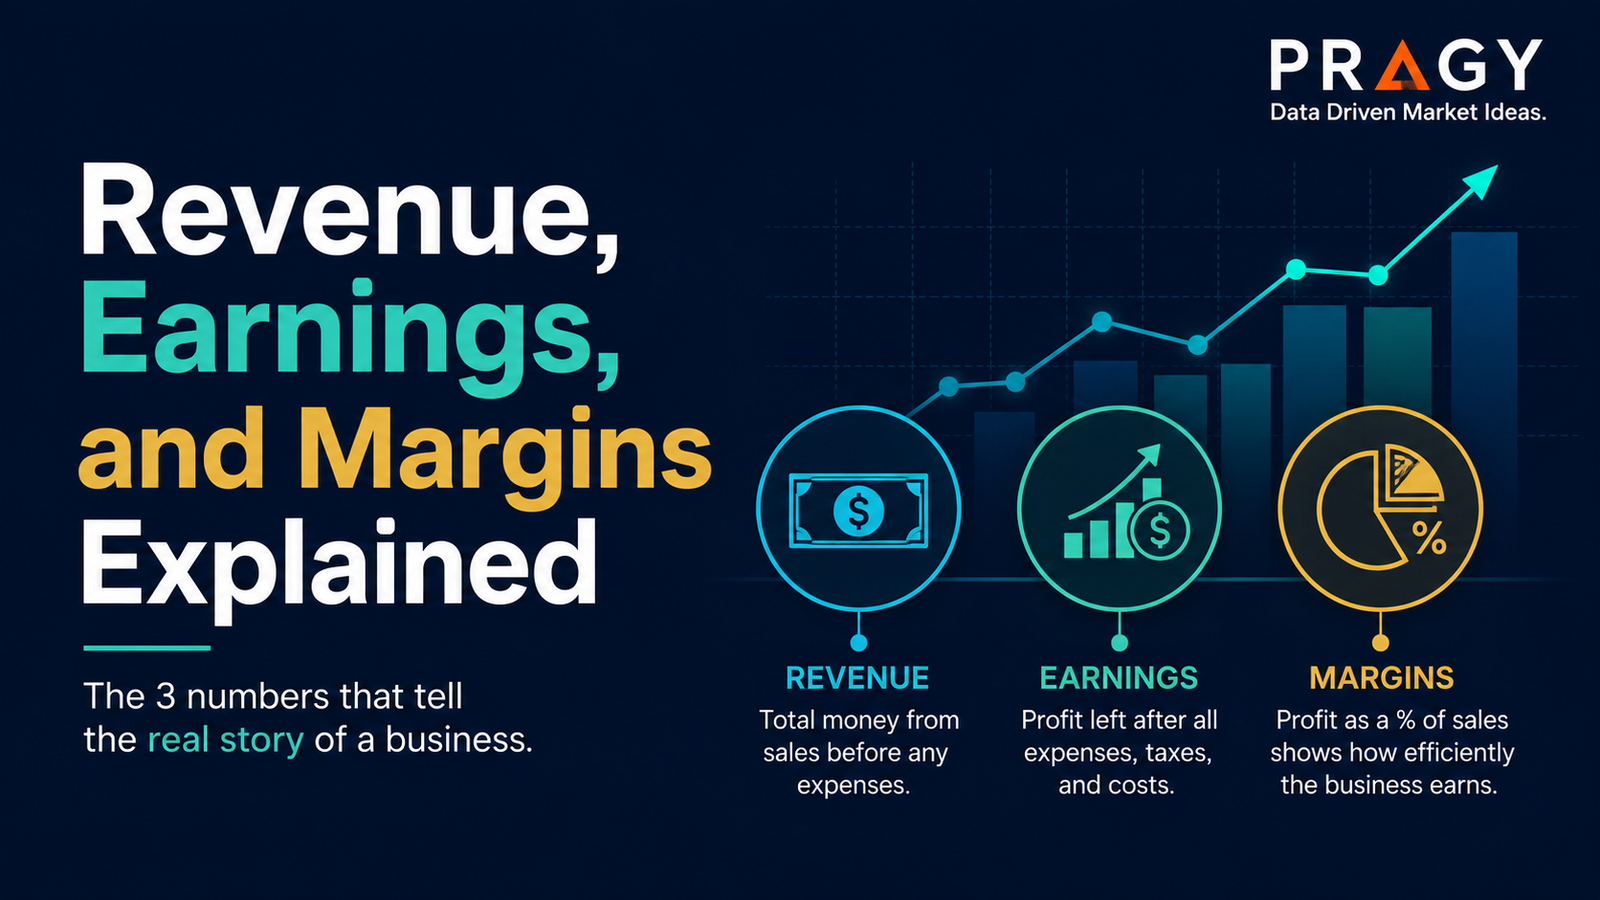
Here’s the deal: revenue tells you how much money came in, earnings tell you what was left, and margins tell you how efficiently the company turned sales into profit.
That’s the clean version.
Now let’s make it useful.
Here’s the simple version
Think of a business like a restaurant.
The restaurant sells meals. That money is revenue.
Then it pays for food, wages, rent, delivery apps, equipment, marketing, and taxes. After those costs, whatever profit remains is earnings.
Margins show the percentage relationship between sales and profit. They help answer: “For every dollar of revenue, how much does the business actually keep?”
Simple. Not easy. Big difference.
Revenue: the top line
Revenue is the total amount of money a company brings in from selling products or services before expenses are deducted.
It is often called the top line because it appears near the top of the income statement, which is the financial report showing sales, costs, and profit over a period of time.
If a company sells $100 million worth of products in a quarter, its revenue is $100 million.
Revenue growth can be a green flag, especially when it comes from more customers, higher demand, better pricing, or expansion into new markets.
But revenue alone does not tell the full story.
A company can grow sales and still lose money. That happens when costs rise faster than revenue, pricing is weak, or the business model needs heavy spending just to keep running.
The trap: assuming “more sales” automatically means “better business.”
Not always.
Earnings: what is left after the bills
Earnings are the profits left after a company subtracts expenses from revenue.
You may also see earnings called net income or profit.
A basic version looks like this:
Revenue minus expenses equals earnings.
If a company generates $100 million in revenue and has $85 million in total expenses, it has $15 million in earnings.
Investors often watch earnings because earnings show whether the business is actually converting activity into profit.
A company with growing earnings may be improving pricing, controlling costs, scaling operations, or selling higher-margin products.
But earnings can also be noisy.
One-time gains, restructuring charges, tax changes, asset sales, and accounting adjustments can make a single quarter look stronger or weaker than the real business trend.
This is where people mess up: they look at one earnings number and treat it like the whole movie.
It is usually just one frame.
EPS: earnings per share
EPS, or earnings per share, shows how much profit belongs to each share of stock.
The simplified formula is:
Earnings divided by shares outstanding equals EPS.
If a company earns $100 million and has 50 million shares, EPS is $2.00.
EPS matters because public companies are divided into shares. Investors use EPS to compare profitability across time and against expectations.
But EPS needs context.
A company can increase EPS because profits improved. That is generally cleaner.
A company can also increase EPS because it reduced the number of shares through buybacks. That can still matter, but beginners should notice the difference.
Green flag: EPS rising because the core business is earning more.
Red flag: EPS rising while revenue is flat, margins are weakening, and the company is mostly relying on accounting or share-count changes.
Don’t overcomplicate it. Ask what drove the EPS move.
Margins: the efficiency scorecard
Margins show profit as a percentage of revenue.
They help answer a better question than “Did revenue grow?”
They ask: “How much of each sales dollar does the company keep at different stages?”
There are three beginner-friendly margins worth knowing.
Gross margin
Gross margin shows how much revenue is left after the direct cost of producing or delivering the product or service.
The formula is:
Gross profit divided by revenue equals gross margin.
If a company has $100 million in revenue and $60 million in direct costs, gross profit is $40 million. Gross margin is 40%.
Gross margin helps you understand pricing power and product economics.
High or rising gross margin may suggest the company can charge strong prices, control production costs, or sell products with attractive economics.
Low or falling gross margin may suggest discounting, rising input costs, weak pricing power, or a less profitable mix of products.
The clean version: gross margin tells you whether the basic product or service is attractive before the rest of the business costs show up.
Operating margin
Operating margin shows how much profit remains after operating expenses like sales, marketing, payroll, research, software, and administration.
The formula is:
Operating income divided by revenue equals operating margin.
Operating margin is useful because it shows how well the actual business engine is running before interest and taxes.
A company can have strong gross margin but weak operating margin if it spends heavily to generate sales.
That is not automatically bad. A growing company may spend aggressively to expand.
But eventually, investors want to see whether the business can scale.
Scale means the company can grow revenue without costs rising at the same speed.
Green flag: revenue grows while operating margin improves.
Red flag: revenue grows, but operating margin keeps getting worse with no clear path to improvement.
Net margin
Net margin shows what percentage of revenue becomes final profit after all expenses, including interest and taxes.
The formula is:
Net income divided by revenue equals net margin.
If a company has $100 million in revenue and $10 million in net income, net margin is 10%.
Net margin is the final scoreboard, but it can be affected by financing costs, tax rates, one-time charges, and accounting items.
That is why beginners should avoid using net margin alone.
Better approach: compare gross margin, operating margin, and net margin together.
They tell a fuller story.
A practical example
Imagine two companies both generate $500 million in annual revenue.
Company A
Revenue: $500 million
Gross margin: 60%
Operating margin: 25%
Net margin: 18%
Company B
Revenue: $500 million
Gross margin: 30%
Operating margin: 8%
Net margin: 3%
Same revenue. Very different businesses.
Company A keeps more of each sales dollar at every stage. It may have stronger pricing power, lower direct costs, better operating discipline, or a more profitable product mix.
Company B may still be investable in certain research contexts, but it has less room for error. A small cost increase or sales slowdown could pressure profits quickly.
The point is not that one company is automatically “good” and the other is automatically “bad.”
The point is that revenue alone hides the difference.
Margins reveal the quality of the revenue.
How to read the trio together
Revenue, earnings, and margins are strongest when they are read as a set.
Use this simple framework:
1. Is revenue growing?
Start with demand.
Is the company selling more over time? Is growth consistent? Is growth speeding up or slowing down?
Revenue growth tells you whether the business is expanding.
2. Are earnings growing too?
Next, check profitability.
If revenue is growing but earnings are shrinking, costs may be rising faster than sales.
That does not automatically kill the story, but it deserves attention.
3. Are margins stable or improving?
Margins show whether growth is becoming more efficient.
A business with rising revenue and improving margins may be getting stronger as it scales.
A business with rising revenue and falling margins may be buying growth the expensive way.
4. Is the trend consistent?
One quarter can be messy.
Look across several quarters or years when possible.
The market often cares less about one isolated number and more about the direction of the trend.
Common mistakes beginners make
Mistake 1: Treating revenue growth as the whole story
Revenue growth is exciting. It is also incomplete.
A company can sell more and still destroy profit if costs grow faster.
Revenue is the starting line, not the finish line.
Mistake 2: Ignoring margins
Margins are where the business model shows itself.
Two companies can have similar sales but very different profit quality.
Ignoring margins is like judging a paycheck without looking at expenses.
Mistake 3: Comparing margins across unrelated industries
Software companies, grocery stores, banks, manufacturers, and energy companies do not operate with the same margin structure.
A 5% net margin may be weak in one industry and normal in another.
Compare companies against similar business models, not random tickers.
Mistake 4: Overreacting to one quarter
Quarterly numbers can be affected by timing, inventory, taxes, currency, one-time costs, and management decisions.
Look for patterns.
One data point is a clue. A trend is more useful.
Mistake 5: Forgetting cash flow
Earnings are based on accounting rules. Cash flow shows actual cash moving in and out of the business.
A company can report earnings while struggling with cash generation.
For a stronger read, compare earnings with operating cash flow and free cash flow. Free cash flow means cash left after the company pays for the investments needed to maintain or grow the business.
Action checklist
Before you get impressed by a company’s headline numbers, ask:
- Is revenue growing, flat, or shrinking?
- Are earnings moving in the same direction as revenue?
- Are gross, operating, and net margins stable, improving, or weakening?
- Are margins being compared against similar companies?
- Did one-time items affect earnings?
- Is EPS growth coming from better profits, fewer shares, or both?
- Does cash flow support the earnings story?
- Is the trend visible across multiple periods?
Use the checklist as a filter, not a prediction machine.
Financial statements do not tell you the future. They help you understand the business more clearly.
Final takeaway
Revenue tells you the size of the business.
Earnings tell you what the business kept.
Margins tell you how efficiently the business turned sales into profit.
The beginner mistake is looking at one number in isolation. The better move is reading the relationship between all three.
Here’s the simple mental model:
Revenue is demand.
Earnings are profit.
Margins are quality.
Once you see that, company fundamentals become much less intimidating.
Disclaimer
Educational content only. Not personalized guidance or a recommendation to buy, sell, or hold any security. Trading and investing involve risk, including possible loss of capital.