
Valuation sounds fancy until you realize the basic question is simple:
How much are investors paying for the business?
That’s it.
The problem is that people love turning valuation into a single magic number. They see a low P/E ratio and assume a stock is cheap. They see a high P/S ratio and assume it is expensive. They compare EV/EBITDA across totally different industries and act like they found the answer.
Here’s the deal: valuation ratios are useful. They are not truth machines.
They are shortcuts. Good shortcuts, when used properly. Dangerous shortcuts, when used alone.
Here’s the simple version
Valuation ratios help compare a company’s market price against a business metric.
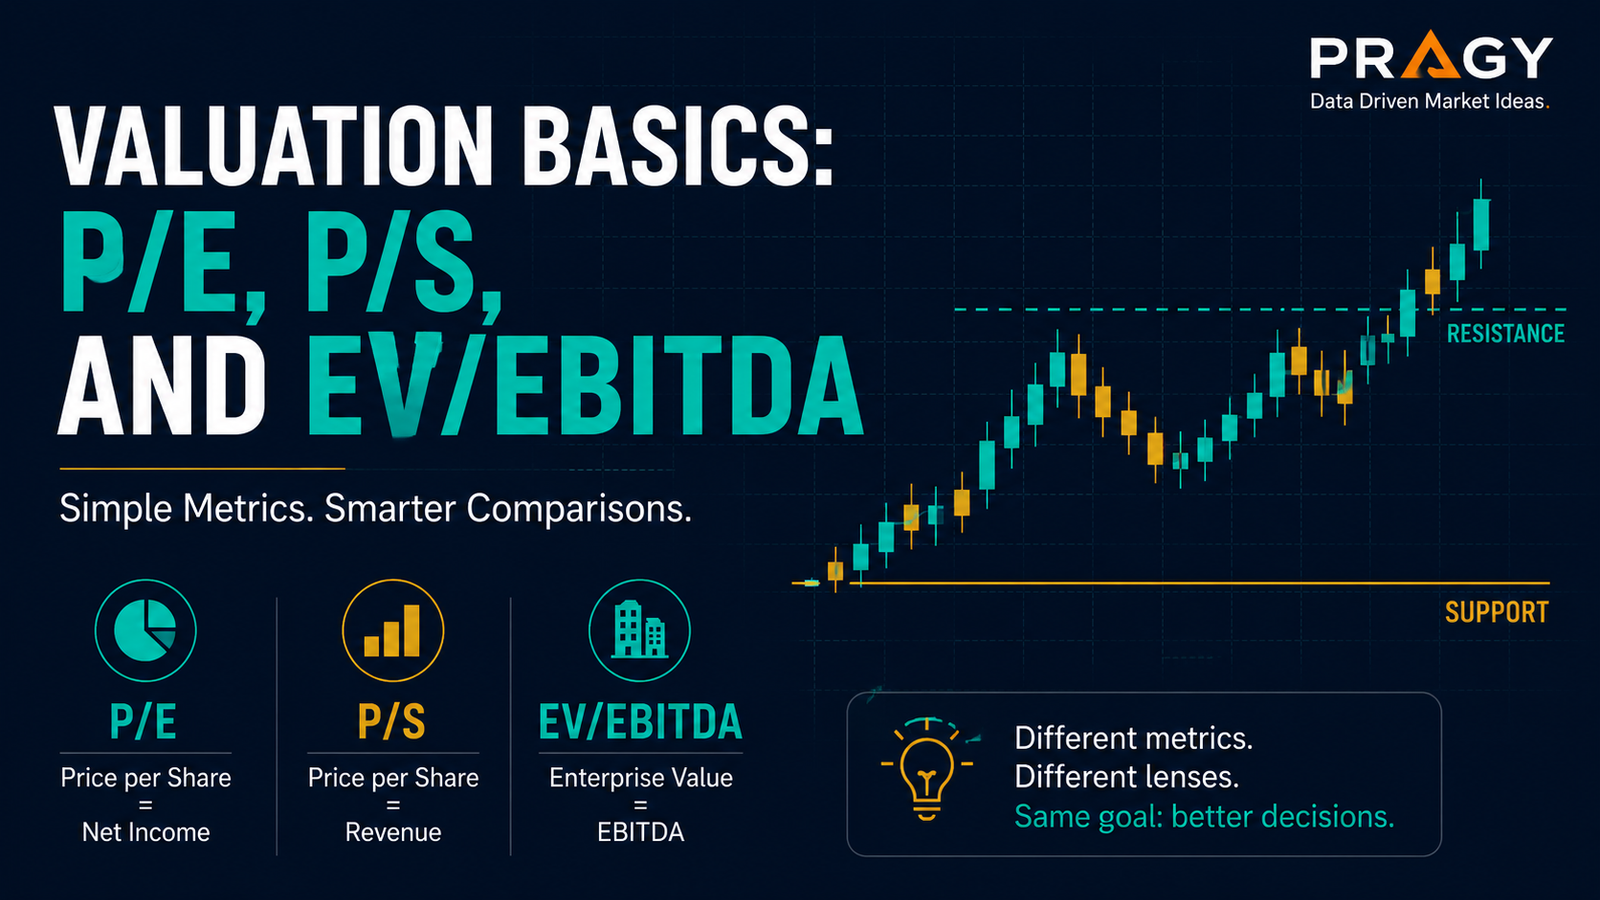
The three beginner-friendly ratios to understand first are:
- P/E ratio: price compared to earnings
- P/S ratio: price compared to sales
- EV/EBITDA: enterprise value compared to operating cash-flow-like profitability
The clean version:
P/E tells you what investors pay for profits.
P/S tells you what investors pay for revenue.
EV/EBITDA tells you what buyers may pay for the operating business before financing and accounting noise.
Each one answers a different question.
Use them together, not as isolated scoreboard numbers.
What is the P/E ratio?
P/E means price-to-earnings.
It compares a company’s stock price to its earnings per share, also called EPS. Earnings per share is the company’s profit divided by the number of shares.
The basic formula:
P/E = Share Price / Earnings Per Share
Example:
If a stock trades at $50 and earns $5 per share, its P/E ratio is:
$50 / $5 = 10x P/E
That means investors are paying $10 for every $1 of annual earnings.
What P/E is useful for
P/E works best when a company is already profitable and its earnings are reasonably stable.
It can help compare:
- a company against its own historical valuation
- similar companies in the same industry
- current market expectations versus future growth assumptions
A higher P/E usually means the market expects stronger future growth, better quality earnings, or lower perceived risk.
A lower P/E may mean the market expects slower growth, weaker quality, higher risk, or a business problem.
Notice the word may.
Low does not automatically mean cheap. High does not automatically mean expensive.
The P/E trap
This is where people mess up.
They treat P/E like a shopping discount sticker.
A stock at 8x earnings is not automatically better than a stock at 30x earnings. The 8x stock might have shrinking profits, debt problems, weak margins, or a broken business model. The 30x stock might have strong growth, excellent returns on capital, and durable pricing power.
Red flag: using P/E without asking whether earnings are stable, recurring, and likely to grow.
Green flag: comparing P/E to earnings quality, growth, balance sheet strength, and industry norms.
What is the P/S ratio?
P/S means price-to-sales.
It compares a company’s market capitalization to its revenue.
Market capitalization, or market cap, is the total market value of a company’s equity.
The basic formula:
P/S = Market Capitalization / Annual Revenue
Example:
If a company is worth $10 billion in the market and generates $5 billion in annual revenue:
$10B / $5B = 2x P/S
That means investors are paying $2 for every $1 of annual sales.
What P/S is useful for
P/S is often useful when a company has revenue but little or no profit yet.
That can happen with:
- younger growth companies
- cyclical businesses during weak periods
- turnaround companies
- companies investing heavily for future growth
P/S can help answer:
How much is the market paying for each dollar of revenue?
But revenue is not profit.
A company can sell a lot and still lose money.
The P/S trap
The trap is forgetting margins.
Margins show how much of each dollar of revenue turns into profit. A company with high margins can justify a very different sales multiple than a company with thin margins.
Example:
Company A has $1 billion in revenue and 30% operating margins.
Company B has $1 billion in revenue and 3% operating margins.
Same sales. Very different business quality.
If both trade at the same P/S ratio, the comparison may be misleading.
Don’t overcomplicate it: P/S needs a margin check.
What is EV/EBITDA?
EV/EBITDA sounds like finance alphabet soup, but the idea is practical.
EV means enterprise value. It estimates the total value of the business, including equity and debt, minus cash.
A simple version:
Enterprise Value = Market Cap + Debt - Cash
EBITDA means earnings before interest, taxes, depreciation, and amortization. It is often used as a rough measure of operating profitability before financing and certain accounting expenses.
The basic formula:
EV/EBITDA = Enterprise Value / EBITDA
Example:
If a company has an enterprise value of $20 billion and EBITDA of $4 billion:
$20B / $4B = 5x EV/EBITDA
That means the operating business is valued at about 5 times EBITDA.
Why EV/EBITDA matters
EV/EBITDA is useful because it considers debt and cash.
Two companies may have the same market cap, but one may carry much more debt. Looking only at stock price or market cap can miss that.
EV/EBITDA can help compare companies with different capital structures.
Capital structure means how a business is funded: equity, debt, or a mix of both.
The EV/EBITDA trap
EV/EBITDA can make a company look cleaner than it really is.
EBITDA ignores capital spending, taxes, interest, and working capital needs. That matters.
A business can report healthy EBITDA but still require heavy reinvestment just to stay competitive.
Examples include:
- airlines
- telecom companies
- manufacturers
- energy producers
- infrastructure-heavy businesses
The ratio is useful. It just does not replace cash-flow analysis.
P/E vs. P/S vs. EV/EBITDA
Here’s the practical comparison.
| Ratio | Best for | Watch out for |
|---|---|---|
| P/E | Profitable companies with meaningful earnings | Earnings quality, cyclicality, one-time gains |
| P/S | Companies with revenue but weak or negative earnings | Margins, profitability path, dilution |
| EV/EBITDA | Comparing operating businesses with different debt levels | Capital spending, debt risk, cash conversion |
The point is not to pick one favorite ratio.
The point is to match the ratio to the business.
A simple valuation framework for beginners
Use this four-step framework before forming any valuation opinion.
1. Start with the business type
Ask:
- Is the company profitable?
- Is revenue growing?
- Are margins improving or shrinking?
- Is the business cyclical?
- Does it carry heavy debt?
A cyclical company is one whose results rise and fall with the economy, commodity prices, or industry cycles.
Valuation ratios behave differently across business types.
2. Compare against similar companies
Valuation is relative.
A software company and a steel company should not usually be compared using the same expectations. Their margins, growth rates, capital needs, and risk profiles are different.
Better comparison:
- same industry
- similar growth profile
- similar margin structure
- similar balance sheet risk
- similar business maturity
3. Compare against history
A company’s own historical valuation can be useful.
Ask:
- Is the current ratio above or below its normal range?
- Did the business quality improve?
- Did growth slow down?
- Did debt increase?
- Did margins change?
A lower multiple may be justified if the business got worse.
A higher multiple may be justified if the business got better.
4. Connect valuation to expectations
Every valuation ratio contains a story.
A high multiple often implies strong future expectations.
A low multiple often implies lower expectations or higher risk.
The useful question is:
What has to go right for this valuation to make sense?
That question is more powerful than asking whether the number looks cheap or expensive.
Practical example: two companies, same P/E
Imagine two companies both trade at 15x earnings.
At first glance, they look equally valued.
But look closer:
Company A
- revenue growing 3%
- margins declining
- high debt
- inconsistent earnings
- industry facing pressure
Company B
- revenue growing 15%
- margins stable
- low debt
- strong recurring revenue
- improving cash flow
Same P/E. Different setup.
Company B may deserve the higher-quality interpretation. Company A may deserve caution even at the same multiple.
This is why valuation needs context.
Common mistakes beginners make
Mistake 1: Calling a stock cheap because the P/E is low
A low P/E can mean value. It can also mean the market expects trouble.
Look for the reason.
Mistake 2: Using P/S without checking margins
Revenue is not the same as profit.
A low-margin business deserves a different lens than a high-margin business.
Mistake 3: Comparing companies from different industries
A bank, retailer, software company, and mining company can all have wildly different normal valuation ranges.
Industry context matters.
Mistake 4: Ignoring debt
Debt can change the real valuation picture.
That is why enterprise value can be helpful.
Mistake 5: Forgetting that ratios are backward-looking
Many ratios use past earnings, sales, or EBITDA.
Markets care about the future.
The past is useful, but expectations drive price.
Valuation checklist
Before using P/E, P/S, or EV/EBITDA, run this checklist:
- Is the company profitable?
- Are earnings normal or temporarily distorted?
- Is revenue growth accelerating or slowing?
- Are margins strong, weak, improving, or deteriorating?
- How much debt does the company carry?
- Is the industry cyclical or stable?
- How does the ratio compare with similar companies?
- How does the ratio compare with the company’s own history?
- What future expectations are already priced in?
- What could invalidate the valuation story?
Invalidation means the point where your original idea no longer makes sense.
For valuation, invalidation might come from falling margins, slowing growth, rising debt, weaker cash flow, or a business model that stops performing as expected.
Final takeaway
Valuation is not about finding one perfect number.
It is about understanding what price the market is putting on sales, profits, and operating performance — then asking whether that price makes sense given the business quality and future expectations.
P/E, P/S, and EV/EBITDA are not competing tools. They are different lenses.
Use P/E when earnings matter.
Use P/S when revenue is the cleaner starting point.
Use EV/EBITDA when debt and operating profitability need a closer look.
The clean version: ratios start the conversation. They do not finish it.
Disclaimer
Educational content only. Not financial advice, not a recommendation to buy, sell, or hold any security. Trading and investing involve risk, including possible loss of capital.