
Options flow can look smarter than it really is.
A contract suddenly trades 5,000 times. The scanner flashes. The chat room starts yelling. Someone calls it “unusual activity” before asking the most basic question:
Unusual compared to what?
That is where volume and open interest matter.
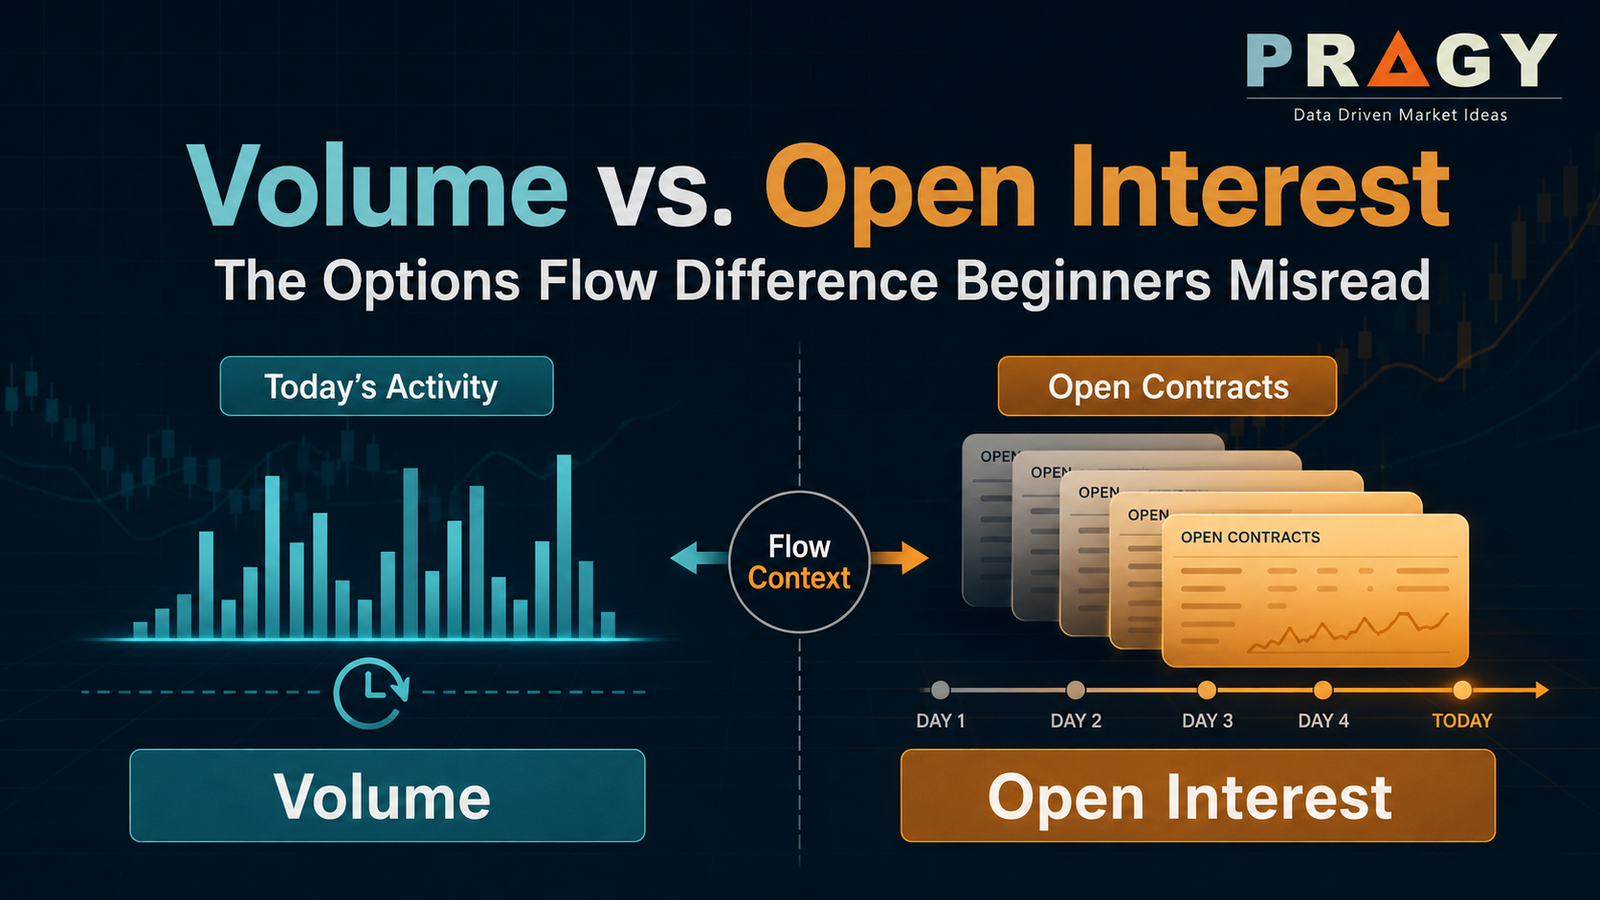
They are two of the most useful columns on an options chain, but beginners often treat them like the same thing. They are not. One measures activity today. The other measures contracts still open.
That difference can change the entire interpretation.
Source check date: June 29, 2026. This article uses stable educational examples and does not rely on live market prices.
Here’s the simple version
Volume tells you how many contracts traded during the current session.
Open interest tells you how many contracts remain open after previous trading activity.
The clean version:
| Metric | Plain-English meaning | Timeframe | Best use |
|---|---|---|---|
| Volume | “How much traded today?” | Current trading session | Spotting activity, attention, and possible urgency |
| Open interest | “How much is still open?” | Carries across sessions | Understanding existing participation and possible liquidity |
| Volume vs. open interest | “Is today unusual?” | Compared together | Finding contracts that may deserve more context |
Volume is the noise of the day.
Open interest is the footprint left behind.
You need both.
What volume means in options
Volume is the number of option contracts traded during a specific session. If 750 contracts trade today in one call option, that contract’s daily volume is 750.
Volume resets each trading day.
That makes it useful for spotting fresh activity. When a quiet contract suddenly shows high volume, something changed. Maybe a catalyst is approaching. Maybe a trader is opening a new position. Maybe a spread is being built. Maybe someone is closing a position and the scanner is getting dramatic.
The point: volume tells you activity happened.
It does not tell you why.
What high volume can suggest
High options volume can suggest:
- active interest in a specific strike and expiration
- better short-term liquidity
- a possible catalyst or event focus
- attention around a price level
- opening, closing, rolling, or spread activity
Notice the word suggest.
Volume is a clue, not a verdict.
What open interest means in options
Open interest is the number of outstanding option contracts that remain open. These are contracts that have not been closed, exercised, assigned, or expired.
Open interest does not reset every morning. It carries forward until positions are reduced or eliminated.
That makes it useful for understanding whether a contract already has market participation.
A contract with high open interest usually has more visible participation than a contract with almost no open interest. That can matter for liquidity, spreads, and flow context.
Liquidity means how easily something can be traded without causing a large price change. In options, higher volume and higher open interest can sometimes support better liquidity, but they do not guarantee perfect fills.
The key difference
Here is the part beginners need to tattoo on the inside of their eyelids:
Volume counts contracts traded today. Open interest counts contracts still open.
Those are not the same.
A contract can have:
- high volume and low open interest
- high open interest and low volume
- high volume and high open interest
- low volume and low open interest
Each situation tells a different story.
How open interest actually changes
Open interest changes based on whether trades create new contracts, close existing contracts, or transfer an existing open contract from one trader to another.
| Trade pairing | What happens to open interest | Simple explanation |
|---|---|---|
| Buyer opens + seller opens | Increases | A new contract is created. |
| Buyer closes + seller closes | Decreases | An existing contract is closed. |
| One side opens + one side closes | No change | An existing contract changes hands. |
| Exercise, assignment, or expiration | Can decrease | The contract is removed from open interest. |
This is why open interest is not always obvious from the trade print alone.
A 2,000-contract trade could create new open interest. It could close existing open interest. It could transfer risk between participants. Without more context, you do not know.
Why volume above open interest gets attention
Flow watchers often look for contracts where today’s volume is greater than existing open interest.
Why?
Because it may suggest fresh activity.
Example:
- Prior open interest: 120 contracts
- Today’s volume: 2,400 contracts
That is worth noticing. The contract traded far more today than the number of contracts that were already open before the session.
But do not overstate it.
This does not automatically prove a new directional position. It may still be:
- a spread
- a hedge
- a closing trade
- a roll
- market-maker activity
- event volatility positioning
The better conclusion is:
“This contract deserves context.”
Not:
“Someone knows something.”
Four common volume/open interest setups
1) High volume, low open interest
This is the flashy one.
A contract had little existing participation, then suddenly traded heavily.
Possible interpretation:
- fresh activity may be entering the contract
- a catalyst may be attracting attention
- the trade may be unusual relative to normal activity
Risk of misreading:
- the activity may be a spread leg
- it may close later in the same session
- open interest will not confirm the story until after it updates
- high volume alone does not prove bullish or bearish conviction
This setup is interesting, but it needs a second look.
2) High volume, high open interest
This means the contract was already active and traded heavily again today.
Possible interpretation:
- the option line may be liquid
- active participants may already be using that strike
- tighter bid/ask spreads may be more likely than in thin contracts
Risk of misreading:
- heavy volume may simply be routine activity in a popular contract
- today’s trade may not be unusual relative to the name
- the high open interest may represent old positioning, not fresh conviction
This setup can be useful for liquidity context, but it is not automatically a signal.
3) Low volume, high open interest
This means many contracts are open, but not much traded today.
Possible interpretation:
- prior activity created a large outstanding position
- traders may be waiting for a catalyst
- the contract may matter near expiration, especially around key strikes
Risk of misreading:
- old open interest can sit there without meaning much today
- low current volume may mean little active interest right now
- a large open interest number does not tell you whether the position is bullish, bearish, hedged, or part of a spread
This setup is a footprint, not a fresh alarm bell.
4) Low volume, low open interest
This is usually the least informative.
Possible interpretation:
- little activity
- limited participation
- potentially wider bid/ask spreads
Risk of misreading:
- a single small trade can look dramatic on a percentage basis
- low-liquidity contracts can be harder to interpret
Sometimes the best read is: nothing useful yet.
A practical example
Imagine a fictional stock, ABC, trading near $50.
A beginner opens the option chain and sees two call contracts:
| Contract | Prior open interest | Today’s volume | What a beginner might think | Better interpretation |
|---|---|---|---|---|
| $55 call expiring this week | 40 | 1,800 | “Huge call buying!” | Interesting activity, but check spread structure, bid/ask execution, catalyst, and next-day open interest. |
| $50 call expiring next month | 12,500 | 2,100 | “Even bigger signal!” | Active contract, but today’s volume may be normal relative to existing participation. |
| $60 call expiring in three months | 3,900 | 30 | “Lots of open interest means bullish!” | Old positioning may exist, but today’s activity is quiet. |
| $70 call expiring this week | 5 | 8 | “Tiny contract, ignore?” | Probably limited context unless tied to a clear strategy or unusual event. |
The mistake is trying to turn one number into a full story.
Volume tells you what traded.
Open interest tells you what remained open.
Neither tells you motive by itself.
The next-day open interest check
One useful habit is checking open interest after it updates.
Suppose a contract had:
- prior open interest: 100
- today’s volume: 2,000
The next day, open interest rises to 1,900.
That would support the idea that much of the activity may have opened new positions.
But suppose open interest stays near 100 or falls.
That might suggest the volume was largely closing, intraday activity, spread-related, or otherwise not a clean new-position signal.
Still, be careful. Open interest is helpful, but it is not a perfect detective.
Why volume and open interest do not prove direction
A common beginner mistake is thinking:
- call volume = bullish
- put volume = bearish
- high open interest = conviction
- high volume above open interest = guaranteed new buying
The market is messier than that.
A call trade could be:
- bought for speculation
- sold as part of covered-call activity
- one leg of a call spread
- a hedge against a short position
- part of a volatility strategy
A put trade could be:
- bought for downside speculation
- bought as protection on a long stock position
- sold as a cash-secured put
- one leg of a spread
- part of a collar
This is why options flow should be read as research context, not instruction.
What to combine with volume and open interest
Volume and open interest get better when they are paired with other evidence.
| Context layer | Question to ask | Why it helps |
|---|---|---|
| Bid/ask execution | Did the trade occur near the bid, ask, or midpoint? | Can hint at buyer or seller aggression, but not prove it. |
| Premium | How much money was involved? | Large premium may matter, but can be inflated by stock price, IV, or time. |
| Expiration | Is this weekly, monthly, or long-dated? | Short-dated activity may reflect event timing; long-dated activity may reflect structure or hedging. |
| Strike location | Is the strike near the current price or far away? | Helps judge whether the contract is close to the action or highly speculative. |
| Implied volatility | Is IV elevated? | High IV can make options expensive and distort premium interpretation. |
| Stock catalyst | Is there earnings, news, FDA data, macro exposure, or sector movement? | Flow often makes more sense when connected to a known catalyst. |
| Chart location | Is the stock near support, resistance, or a breakout zone? | Flow is more useful when the underlying setup has structure. |
| Repeated activity | Are similar contracts trading repeatedly? | Repetition can be more meaningful than one isolated print. |
Common mistakes
Mistake 1: Treating volume as open interest
Volume is today’s activity. Open interest is outstanding contracts. Mixing them up creates bad reads.
Mistake 2: Thinking open interest updates in real time
Open interest is not a live second-by-second sentiment meter. It updates after clearing activity is processed.
Mistake 3: Assuming high volume means opening trades
High volume can be opening, closing, rolling, spreading, or hedging. It needs confirmation.
Mistake 4: Ignoring the rest of the strategy
One leg of a spread can look very directional if you do not see the other leg.
Mistake 5: Forgetting liquidity
A contract with low volume and low open interest may be harder to interpret and may have wider bid/ask spreads.
Mistake 6: Calling flow “smart money”
Options activity can be smart, dumb, defensive, mechanical, hedged, or completely unrelated to the simple story being told online.
A clean checklist for reading volume vs. open interest
Before treating a flow print as important, ask:
- What is today’s volume?
- What was the prior open interest?
- Is volume unusually high for this contract?
- Did open interest increase after the trade date?
- Is the trade likely single-leg or part of a spread?
- Is the contract liquid enough to read cleanly?
- Is the strike near a meaningful price level?
- Is there a catalyst?
- Is implied volatility elevated?
- Does the flow repeat, or is it one lonely print?
The goal is not to find certainty.
The goal is to avoid fooling yourself.
Final takeaway
Volume and open interest are not magic signals. They are context tools.
Volume tells you what traded today. Open interest tells you what remains open.
When volume explodes above open interest, pay attention. When open interest is high, respect the existing footprint. But never turn either number into a standalone trading conclusion.
The sharper question is not:
“Is the number big?”
The sharper question is:
“What does this number mean relative to the contract, the stock, the catalyst, and the strategy?”
That is how options flow becomes research instead of noise.
Sources
- Options Industry Council (OIC), Open Interest: Why It Matters: https://www.optionseducation.org/news/open-interest-why-it-matters
- Options Industry Council (OIC), Market Data: https://www.optionseducation.org/referencelibrary/market-data
- FINRA, Options investor education overview: https://www.finra.org/investors/investing/investment-products/options
- Cboe, U.S. Options Daily Market Statistics: https://www.cboe.com/markets/us/options/market-statistics/daily/
Disclaimer
Pragy Investments provides financial education and market research only. This content is not investment advice, financial planning, portfolio management, tax advice, legal advice, or a recommendation to buy, sell, or hold any security. Examples and scenarios are for educational purposes only. Investing and trading involve risk, including possible loss of capital. Readers are responsible for their own decisions and should consult an appropriately qualified professional where needed. Options involve additional risks and may not be suitable for all investors. Options activity can reflect speculation, hedging, multi-leg strategies, volatility positioning, or other motives and does not by itself establish directional conviction.