
VWAP is one of those indicators traders mention constantly, usually with the confidence of someone who has either studied it properly or watched three videos and started drawing conclusions.
Here’s the deal: VWAP can be useful. Very useful, actually.
But it is not a magic line. It does not know your entry, your account size, your emotions, or your tendency to chase candles after drinking too much coffee.
VWAP works best as context. It helps active traders understand where price is trading relative to the average price paid during the session, weighted by volume. That sounds fancy. It is not.
Let’s clean it up.
Here’s the simple version
VWAP stands for Volume Weighted Average Price.
It shows the average price of a stock during a trading session, but it gives more importance to prices where more shares traded.
That last part matters.
A simple average treats every price equally. VWAP does not. If a stock briefly taps one price with low volume, VWAP does not care much. If a large amount of trading happens at another price, VWAP pays attention.
The clean version:
VWAP helps answer one intraday question: is price trading above, below, or around the session’s volume-weighted average?
That is it.
Not a prediction machine. Not a guaranteed reversal zone. Not a green light to enter every time price touches the line.
It is a reference point.
What VWAP actually measures
VWAP is calculated using price and volume.
Volume means how many shares traded during a period. Higher volume means more participation.
A simplified VWAP formula looks like this:
VWAP = cumulative price × volume / cumulative volume
Many platforms use typical price in the calculation, which often combines the high, low, and close of each candle. You do not need to hand-calculate it. Your charting software does that part.
What matters is the logic.
VWAP rises when heavier trading happens at higher prices. VWAP falls or flattens when heavier trading happens lower or price stops making progress.
For most active traders, VWAP resets at the start of each trading session. That is why it is commonly used on intraday charts like the 1-minute, 5-minute, or 15-minute chart.
Why active traders care about VWAP
Active traders usually care about execution, timing, and intraday structure.
Execution means how you enter, manage, and exit a trade idea in real time.
VWAP helps because it gives a shared reference point. Many traders, funds, algorithms, and execution desks watch it. That does not make it perfect. It simply means it can become a meaningful area on the chart.
Think of VWAP as a session compass.
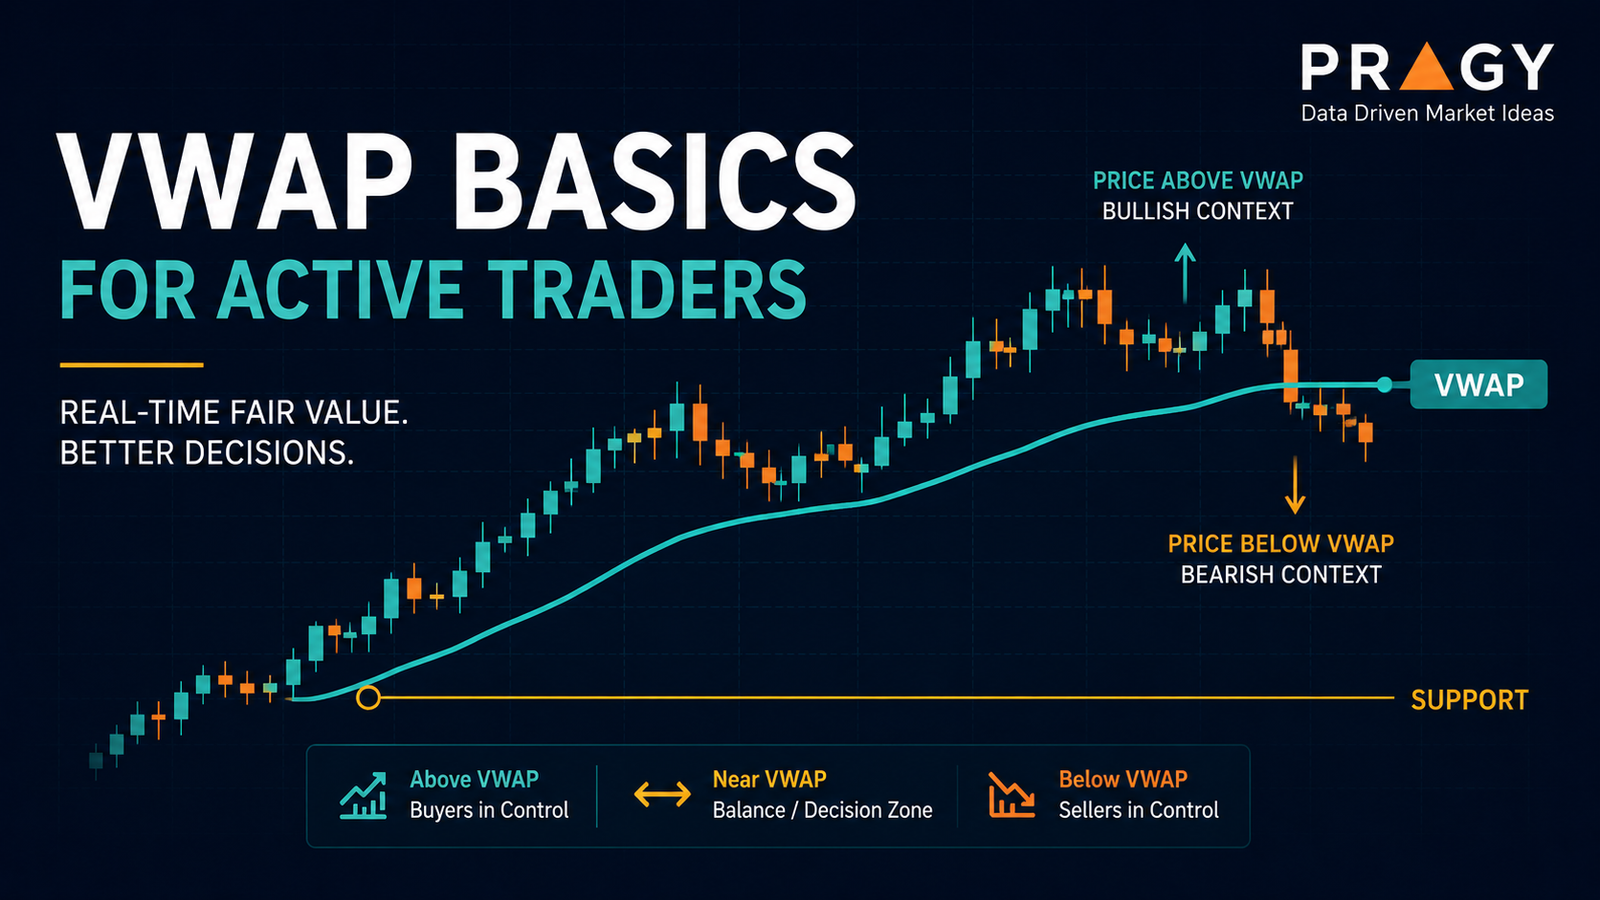
Price above VWAP may suggest buyers are more in control during that session.
Price below VWAP may suggest sellers have more control.
Price chopping around VWAP may suggest indecision.
Chop is messy sideways price action where neither buyers nor sellers clearly control the move.
This is where people mess up: they treat every VWAP touch like a trade setup.
A VWAP touch is not enough. You still need structure, risk, and a reason.
VWAP above, below, and around price
VWAP is most useful when you read it in relation to price.
Price above VWAP
When price stays above VWAP, it can suggest intraday strength.
That does not mean price must keep rising. It means, so far, the market is accepting prices above the session’s volume-weighted average.
A trader might study whether pullbacks toward VWAP are controlled or aggressive.
A pullback is a temporary move against the main trend.
A controlled pullback above VWAP can show that buyers are still defending the session structure. A fast, heavy-volume drop through VWAP may tell a different story.
Price below VWAP
When price stays below VWAP, it can suggest intraday weakness.
Again, not a prediction. Just context.
If price keeps rejecting near VWAP from below, the line may act like a decision area. Buyers are trying to reclaim the average, while sellers are defending it.
Price around VWAP
When price keeps slicing above and below VWAP, the session may be messy.
Red flag: price crossing VWAP every few candles with no clean direction.
That is often a sign to slow down. VWAP loses clarity when the market is stuck in chop.
Do not overcomplicate it. If the line is not helping you see structure, it is not doing its job for that moment.
VWAP is not support or resistance by itself
Beginners often say, “VWAP is support,” or “VWAP is resistance.”
Sometimes it behaves that way. But VWAP is not automatically either.
Support is an area where buyers have previously stepped in.
Resistance is an area where sellers have previously stepped in.
VWAP becomes more interesting when it overlaps with real price structure. For example:
- VWAP lines up with a prior intraday support zone.
- VWAP sits near the day’s breakout level.
- VWAP is close to a higher timeframe level.
- VWAP is reclaimed after a strong move with volume.
A higher timeframe means zooming out to see the bigger trend before making a smaller entry decision. For beginners, a clean starting point is using the daily chart for the big picture and the 1-hour chart to refine the setup.
The trap is thinking VWAP alone is the setup.
It is not.
VWAP plus structure is useful. VWAP without context is just a line.
A practical VWAP reading framework
Use this simple framework before making any active trading interpretation.
1. Start with the higher timeframe
Before staring at a 5-minute chart, zoom out.
Is the stock trending higher on the daily chart? Is it stuck in a range? Is it near a major support or resistance area?
This helps you avoid giving too much importance to tiny intraday noise.
2. Identify the session bias
Now look at VWAP.
Ask:
- Is price mostly above VWAP?
- Mostly below VWAP?
- Chopping around it?
- Moving away from it with strength?
- Reclaiming it after a weak open?
You are not looking for certainty. You are building context.
3. Watch how price reacts at VWAP
A reaction matters more than a touch.
Look for whether candles close above or below VWAP.
A candlestick is a chart bar that shows the open, high, low, and close for a specific time period. The thick part is the body. The thin line above or below is the wick, which shows how far price moved before closing.
A quick wick through VWAP followed by a close back on the original side may show rejection. A clean close through VWAP with stronger volume may show a shift in control.
4. Define invalidation before entry
Invalidation is the price level or area where the trade idea is no longer valid.
If your idea depends on price holding above VWAP, then a clean loss of VWAP may be part of your invalidation.
If your idea depends on price rejecting VWAP from below, then a strong reclaim may invalidate that idea.
No invalidation, no plan.
5. Control position size
Position sizing means deciding how much money to risk on one trade before entering.
A common beginner guardrail is risking about 1% to 2% of total account size on a single trade idea. For example, with a $5,000 account, 1% risk equals $50 of planned risk.
This matters because VWAP can fail. Every level can fail. Risk control is not optional.
Example: reading a VWAP reclaim
Imagine a stock opens weak and trades below VWAP for the first hour.
Sellers look in control. Price tries to bounce, but VWAP rejects it twice.
Then something changes.
Price pushes back into VWAP, holds near it instead of instantly dropping, and then closes above it with stronger volume. The next pullback stays above VWAP.
That is a possible shift in intraday control.
The educational interpretation might be:
“Price moved from below VWAP to above VWAP, then held the reclaim. Buyers may be gaining control for this session.”
Notice the wording.
Not “this must go higher.”
Not “instant entry.”
Not “free money.”
Just context.
The trader still needs a defined setup, invalidation, position size, and risk/reward plan.
Risk/reward compares the amount you plan to risk against the potential upside of the trade idea. For example, risking $1 to potentially make $2 is a 1:2 risk/reward scenario.
VWAP mistakes active traders make
Mistake 1: Treating VWAP like a signal
VWAP does not tell you what to do.
It gives context. You still need price structure, volume, and risk planning.
Mistake 2: Ignoring the higher timeframe
A stock can be above intraday VWAP while running directly into daily resistance.
That matters.
A tiny intraday signal can get crushed by a bigger chart level.
Mistake 3: Trading every VWAP touch
This is the classic beginner trap.
Price touches VWAP. Trader reacts. Price chops. Trader gets frustrated.
Not every touch matters. The quality of the reaction matters.
Mistake 4: Using VWAP in dead chop
When price keeps crossing VWAP repeatedly, the line is probably not giving clean information.
Green flag: VWAP acts as a clear reference during a directional session.
Red flag: VWAP becomes a magnet in sideways noise.
Mistake 5: Forgetting volume
VWAP is volume-weighted. So volume matters.
A reclaim with weak participation may be less meaningful than a reclaim with clear volume expansion.
Mistake 6: No stop loss or invalidation
A stop loss is a planned exit level used to limit damage if the trade goes wrong.
VWAP traders can get into trouble when they assume price “should” hold the line. The market does not owe the line anything.
VWAP action checklist
Before using VWAP in an active trading plan, ask:
- What is the higher timeframe trend or range?
- Is price above, below, or chopping around VWAP?
- Is VWAP lining up with support, resistance, or another useful level?
- Did price react cleanly at VWAP, or just touch it?
- Is volume confirming the move or fading?
- Where is the invalidation level?
- What is the planned position size?
- Does the trade idea still make sense if VWAP fails?
If you cannot answer those questions, the setup is probably not ready.
Final takeaway
VWAP is useful because it gives active traders a clean intraday reference point.
But the real skill is not adding VWAP to your chart. Anyone can do that.
The skill is knowing when VWAP matters, when it does not, and how it fits into the bigger picture.
Use VWAP to read context. Use structure to build the idea. Use risk management to survive being wrong.
That is the professional version.
Disclaimer
Educational content only. Not personalized financial advice or a recommendation to buy, sell, or hold any security. Trading and investing involve risk, and loss of capital is possible.